 |
Under the joint leadership of the Kids First/Reach Higher
Hoboken! majority on the Board of Education, Hoboken High
School has yet to have a graduation rate above the NJ
state average.
|

What do we know about poverty and school dropout rates? Here is a reasonably good summary:
Poverty and dropouts are inextricably connected in the three primary settings affecting healthy child and adolescent development: families, schools and communities*. -American Psychological Association
 |
| Figure 1 Click to Enlarge |
Hoboken does not have poor schools (@$25,000 per student) and it is not a poor community (household income > $105,000 and < 9% poverty) however, about 65% of students do come from economically disadvantaged households as defined by the New Jersey Department of Education (this is NOT the same as "poverty" although the terms are often confusingly interchanged). Economically disadvantaged generally indicates household incomes around 185% of Federal Poverty Guidelines. Poverty is a more extreme economic condition according to federal and state guidelines and by criteria established by the American Psychological Association concerning dropout rate.
Is the continuing below average high school graduation rate in Hoboken a product simply of the percentage of economically disadvantaged students? No. An analysis of the correlation between high school graduation rate and economically disadvantaged status in Hudson County finds a marginally medium correlation coefficient of -.429. The American Psychological Association references three factors which contribute to poverty and dropouts- namely low family income, low funding for schools, and poverty in the community of which only low family income appears to be a contributing factor in Hoboken. Finally, there are a number of other districts in Hudson County where there is a higher High School graduation rate than Hoboken and where all three factors the APA references (low family income, low school funding, and low income in the community) are exerting an enormous impact on students (see West New York and Union City as examples) and yet high graduation rates are being achieved. So, there are local school districts succeeding under much more difficult situations and socioeconomic factors than the Hoboken School District.
It should be noted that below state average graduation rates are not new to the Kids First/Reach Higher Hoboken! Board of Education. In fact, Hoboken High School has had below state graduation rates for five years in a row. Here are previous results people may find interesting: from 2014; from 2013; and this from 2012 (see Figure 3):
 |
| Figure 3: 2012 HS Graduation Rates in Hudson County, NJ Click to Enlarge |
 |
| Figure 4: HS Graduation Tren Data 2011-2013 Click to Enlarge |
And while Kids First/Reach Higher Hoboken! and their supporters would like people to believe they inherited a failing school district, nothing could be further from the truth. It is important to remember that in 2008 Hoboken High School was designated the 2nd Most Improved High School in NJ by New Jersey Monthly and the school won back to back Honorable Mention Awards by US News and World Report in 2008 and 2009. Leadership matters. Under Kids First/Reach Higher Hoboken! the school district was soon suffering and was quickly designated a District in Need of Improvement by the New Jersey Department of Education.
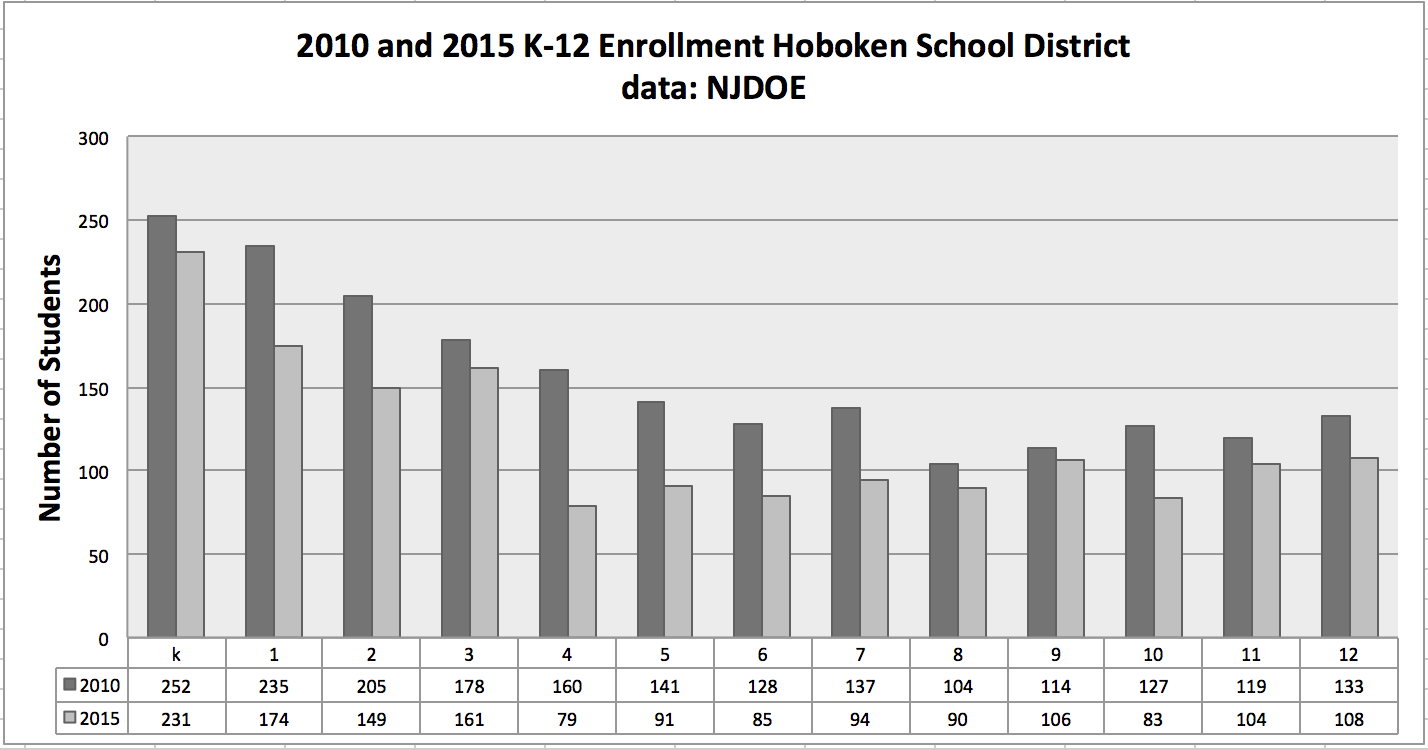
*It is also worth noting that the economically disadvantaged rate in the Hoboken schools is only around 45% in the early grades (K-3) and rises continually as non-economically disadvantaged families with options exercise them and are leaving the Hoboken School district in large numbers (see Figures 5 and 6).
 |
| Figure 5: 2010 ASSA Data- Hoboken School District Click to Enlarge |
 |
| Figure 6: 2015 ASSA Data- Hoboken School District Click to Enlarge |
Why are non-economically disadvantaged families leaving? It is not clear. But perhaps the following trends may be contributing factors into the decision making process for families with options to leave the schools (see Figure 7) during the era of Kids First/Reach Higher Hoboken!:
 |
| Figure 7 Click to Enlarge |
1) lower SAT scores than expected from economic status of student families,
2) designation of the Hoboken School District as a District in Need of Improvement;
3) low rating of the Hoboken School District by independent news organizations;
4) violence, vandalism and bullying in the Hoboken Public Schools; and
5) four consecutive years of failing INSTRUCTION AND PROGRAM as evaluated by the New Jersey Department of Education;
6) recent teacher effectiveness ratings;
7) High School graduation rates;
8) treatment of recognized administrative and instructional leaders such as Dr. Lorraine Cella, Paula Ohaus, and the late Ms. Hillenbrand;
9) hyperbole and exaggeration of educational gains by Board leadership;
Academic and Peer Reviewed References
(used in part or in whole in the preparation of this post)
Belfield, C. & Levin, H. M. Eds. (2007). The price we pay: Economic and social consequences of inadequate education. Washington, D.C.: Brookings Institution Press.
Borman, G. & Dowling, M. (2010). Schools and inequality: A multilevel analysis of Coleman's Equality of Opportunity data. Teachers College Record, 112, 1201-1246.
Chapman, C., Laird, J., Ifill, N., & KewalRamani, A. (2011). Trends in high school dropout and completion rates in the United States: 1972-2009. (NCES 2012-06). Washington, D.C.: National Center for Education Statistics, Institute of Education Sciences, U.S. Department of Education. Retrieved [date]. Source: http://nces.ed.gov/pubsearch/pubsinfo.asp?pubid=2012006
Education Week (June 7, 2012). Diplomas Count 2012: Trailing behind, moving forward: Latino students in U.S. schools. Washington, D.C.: Education Week. Retrieved [date]. Source: http://www.edweek.org/ew/toc/2012/06/07/
Farrington, C. E., Roderick, M., Allensworth, E. , Ngaoka, J., Keyes, T. S., Johnson, D. W., & Beechum, N. O. (2012). Teaching adolescents to become learners: The role of noncognitive factors in shaping school performance. Chicago: Consortium on Chicago School Research, University of Chicago. Retrieved [date]. Source: https://ccsr.uchicago.edu/publications/teaching-adolescents-become-learners-role-noncognitive-factors-shaping-school
Leventhal, T. & Brooks-Gunn, J. (2000). The neighborhoods they live in: The effects of neighborhood residence on child and adolescent outcomes. Psychological Bulletin®, 126, 309-337.
Rumberger, R. W. (2011). Dropping out: Why students drop out of high school and what can be done about it. Cambridge, Mass.: Harvard University Press.
Sampson, R.J., Morenoff, J.D., & Gannon-Rowley, T. (2002). Assessing "neighborhood effects": Social processes and new directions in research. Annual Review of Sociology, 28, 443-478.
Shonkoff, J.P. & Garner, A.S. (2012). The lifelong effects of early childhood adversity and toxic stress. Pediatrics, 129, e232-e246.
Snyder, T. D. & Dillow, S. A. (2012). Digest of Education Statistics 2011. (NCES 2012-001) Washington, D.C.: National Center for Education Statistics, U.S. Department of Education. Retrieved [date].
