Friday, April 26, 2024

Most Recent Hoboken High School Combined SAT Scores Place HHS in Lower 5% of NJDOE District Factor Group; HHS Ranked 299th Among Public High Schools in NJ on SAT Scores

The recently reported 2022-2023 SAT combined scores (math + reading) indicate that Hoboken High School is 42nd out of the 44 districts with high schools in their FG district factor group. District Factor Group is a designation by the NJDOE to categorize districts along 6 common socioeconomic features, specifically: 1) Percent of adults with no high school diploma; 2) Percent of adults with some college education; 3) Occupational status; 4) Unemployment rate; 5) Percent of individuals in poverty; 6) Median family income. 

In essence, the New Jersey Department of Education created district factor groups to compare "apples to apples" rather than "apples to oranges" when it comes to NJ school districts and NJ schools- especially high schools. 

These latest scores position Hoboken High School in the bottom 5% of their NJDOE District Factor Group. Of the 44 FG districts with high schools, the average combined SAT score was 1071.2 and the standard deviation was 53.2. Hoboken High School has a combined score of 972. The HHS score is almost 2 standard deviations below the norm for their DFG. 


HIGH SCHOOL 2023 SATDFG
Monroe Township High School1221FG
Haddon Township High School1146FG
Somerville High School1145FG
Point Pleasant Boro High School1118FG
Fort Lee High School1115FG
Matawan Regional High School1112FG
Dumont High School1108FG
Kingsway Regional High School1107FG
Old Bridge High School1107FG
Kittatinny Regional High School1100FG
Southern Regional High School1098FG
Middlesex High School1096FG
Cinnaminson High School1096FG
Hopatcong High School1096FG
Pompton Lakes High School1095FG
North Brunswick Township High School1095FG
Shore Regional High School1094FG
North Warren Regional School1093FG
Hasbrouch Heights High School1092FG
Point Pleasant Beach High School1091FG
Warren Hills Regional School1091FG
Woodstown High School1090FG
Lakeland Regional High School1089FG
Ocean Township High School1086FG
New Milford High School1081FG
Nutley High School1080FG
Hamilton East - Steinert1074FG
Burlington Township High School1067FG
South Plainfield High School1064FG
West Milford High School1063FG
Delran High School1061FG
Arthut L. Johnson High School1054FG
Vernon Township High School1053FG
Red Bank Regional High School1046FG
Washington Township High School1045FG
Hamilton North-Nottingham1034FG
Passaic Valley Regional High School1029FG
Dunellen High School1020FG
Pitman High School1013FG
Wood-Ridge Jr/Sr High School1000FG
Hamilton West-Watson997FG
Bergenfield High School986FG
Hoboken High School 972FG
Collingswood High School964FG
Hoboken Charter School 919FG
AVERAGE 1071.17778
STANDARD DEVIATION 53.2307536


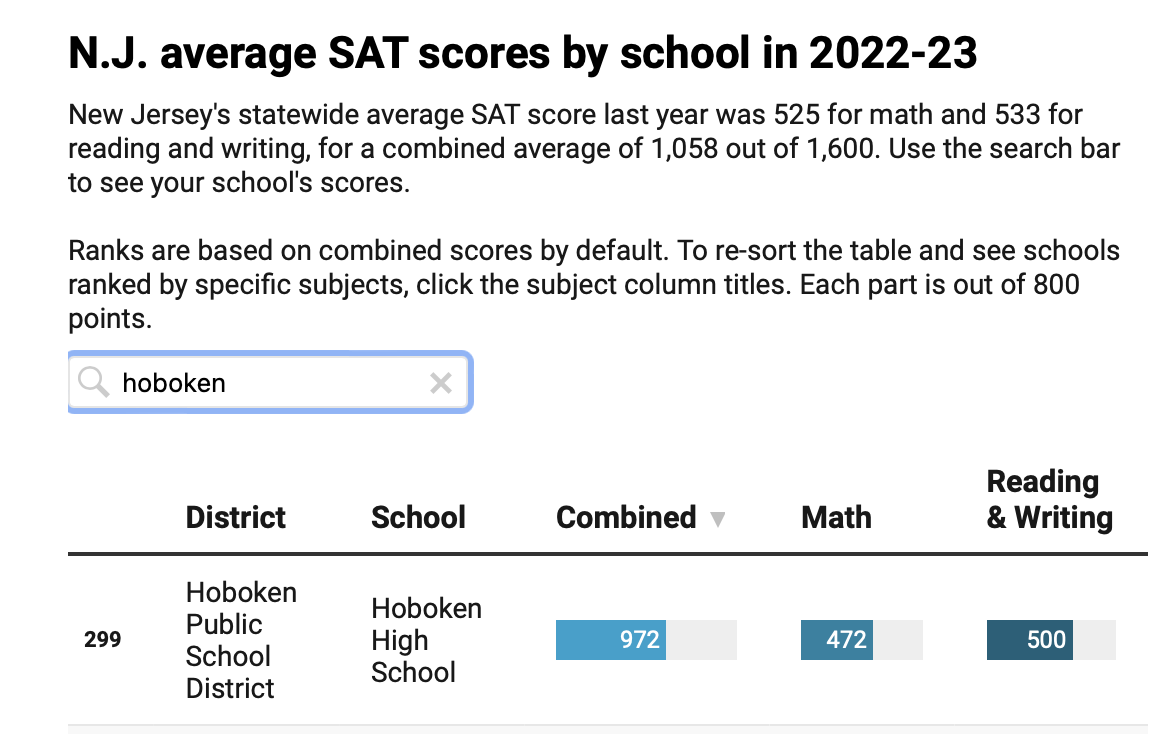
The average SAT score for NJ's public schools was 525 for mathematics and 533 for reading/writing for a combined score of 1,058 out of a 1600 possible score. 

The 2022-23 SAT data shows Hoboken High School has a combined score of 972 with a 472 in Math and a 500 in Reading/Writing. Hoboken HS is ranked 299th in the state according to NJ.COM (see Figure 1). 

Figure 1: HHS 2022-23 SAT Scores /Source NJ.com

The 2022-23 SAT scores were likely foreshadowed by previous NJDOE state assessments in mathematics, science, reading, etc (see Figure 2). While the SAT's and the NJDOE state assessments are different, it is likely they correlate and triangulate as they overlap with disciplinary content knowledge and processes. 


Figure 2: US NEWS AND WORLD REPORT DATA

Note: New Jersey had 314 school districts supporting 426 public high school in the 2022-23 academic year. 

Tuesday, April 23, 2024

Hoboken High School Comes in 299th on 2022-23 New Jersey SAT Scores; District Factor Group Results Low


Newly released data for the 2022-23 school year shows Hoboken High School has a combined score of 972 with a 472 in Math and a 500 in Reading/Writing. Hoboken HS is ranked 299th in the state according to NJ.COM. Hoboken High School’s 2022-23 SAT scores are below average for its “FG” District Factor Group.

School districts in New Jersey are categorized into District Factor Groups, which describe the socioeconomic characteristics of the local district. Based on discussions with representatives from school districts and experimenting with various methods, the DFGs were calculated using the following six variables that have been found to be most closely related to SES:
  1. Percent of adults with no high school diploma
  2. Percent of adults with some college education
  3. Occupational status
  4. Unemployment rate
  5. Percent of individuals in poverty
  6. Median family income.

For overall comparison, the average SAT score for NJ students at the state’s public schools was 525 for math and 533 for the reading and writing section — for a combined score of 1,058 out of 1,600.  

For triangulation purposes, here are the 2023-24 US News and World Report scores for the NJ state testing results for Hoboken High School: 


CLICK TO ENLARGE

Note: 
New Jersey had 314 school districts supporting 426 high schools in the 2022-23 academic year. 

Thursday, April 11, 2024

Petrosino and Colleagues Present at the American Educational Research Association Meeting in Philadelphia

The American Educational Research Association (AERA), a national research society, strives to advance knowledge about education, to encourage scholarly inquiry related to education, and to promote the use of research to improve education and serve the public good.

AERA's more than 25,000 members are faculty, researchers, graduate students, and other distinguished professionals with rich and diverse expertise in education research. They work in a range of settings from universities and other academic institutions to research institutes, federal and state agencies, school systems, testing companies, and nonprofit organizations. Based on their research, they produce and disseminate knowledge, refine methods and measures, and stimulate translation and practical application of research results.


Walking at the Boundaries: Learnings From an RPP (Research-Practice Partnership) Approach to Informal Math LearningFri, April 12, 11:25am to 12:55pm, Pennsylvania Convention Center, Floor: Level 100, Room 112B

Abstract: Research-Practice Partnerships (RPPs) are a collaborative approach to inquiry where university-based researchers and community-based practitioners share in the work of understanding educational problems and creating evidence-based solutions. Theoretically drawing upon boundary spanners, boundary practices, and boundary objects, we aim to understand how boundary crossing is promoted across nine informal learning partners. Initial findings suggest that informal mathematics learning is conceptualized differently across sites. Future research is needed to understand how the boundary crossings change over time.

Authors

Anthony J. PetrosinoMarc Sager, Southern Methodist UniversityMaximilian Sherard, Southern Methodist UniversityCandace A. Walkington, Southern Methodist UniversityJulianna Claiborne Washington, Southern Methodist UniversitySaki L. Milton, Southern Methodist University