Monday, January 6, 2020

David Segarra- Beloved Member of the Hoboken Community

It is with great sadness that I learned about the passing of my friend and colleague in the Hoboken School District,  David Segarra. Mr. Segarra was a Hoboken institution for many years and he was a beloved member of the community. To say he will be missed is a gross understatement. My condolences go out to the Segarra family during this difficult time. 

Viewing for David Segarra will be on Wednesday, January 8, 2019
Lawton-Turso Funeral Home
633 Washington St.
Hoboken, NJ 07030
4pm-8pm


Friday, December 27, 2019

Harron, Petrosino and Jenevein (2019) Using Virtual Reality to Augment Museum-Based Field Trips in a Preservice Elementary Science Methods Course

The following paper represents about 2 years of work with pre-service elementary science teachers and the use of virtual reality in developing museum based activities. Great work by doctoral students Jason Harron and Sarah Jenevein on this research.

Harron, J. R., Petrosino, A. J., & Jenevein, S. (2019). Using virtual reality to augment museum-based field trips in a preservice elementary science methods course. Contemporary Issues in Technology and Teacher Education, 9(4). Retrieved from https://www.citejournal.org/volume-19/issue-4-19/science/using-virtual-reality-to-augment-museum-based-field-trips-in-a-preservice- elementary-science-methods-course

Abstract: Positioned in the context of experiential learning, this paper reports findings of a virtual reality field trip (VRFT) in conjunction with an in- person field trip involving preservice teachers in an elementary science methods course to a local natural history museum. Findings included that virtual reality (VR) is best used after a field trip to encourage student recall of the experience, but only when done for a limited time to avoid VR fatigue. The types of experiences that preservice teachers thought VR would be good for in their science classrooms included the ability to visit either inaccessible or unsafe locations, to explore scales of size that are either too big or too small, and to witness different eras or events at varying temporal scales. Furthermore, this study uncovered potential equity issues related to VRFTs being seen as a viable alternative if students could not afford to go on field trips. Further research needs to be conducted to better understand the impact of VRFTs on student learning outcomes and take advantage of recent improvements in VR technology


Wednesday, December 18, 2019

Explaining the SES Aspect of the Hoboken Public School District's Abysmal Grade 3 to 8 Performance (Reader Comments Allowed)

Chart 1: 2019 Grade Level Scores (Grade 3 to 8)
CLICK TO ENLARGE
A recent post has generated a great deal of interest and conversation. Specifically, the post reported on data emanating from Stanford University's Educational Opportunity Project that indicated the Hoboken Public School District students completing Grades 3 to 8 are 1.27 grade levels below other students from similar socioeconomic backgrounds. Moreover, when compared to all other Hudson County Public School District students from similar socio-economic backgrounds (see Chart 1) the Hoboken Public Schools are abysmal. To be clear, Hoboken scored BY FAR the lowest among all public school districts in Hudson County. Statistically significantly lower-- these numbers are no accident. And this is the second year in a row the district has scored so low.  


DISTRICT 
        GRADE LEVELS

BAYONNE
0.67
Higher 
GUTTENBERG
0.06
Higher 
HARRISON/E. NEWARK
-0.09
Lower
HOBOKEN
-1.27
Lower
JERSEY CITY
-0.24
Lower
KEARNY
0.21
Higher 
NORTH BERGEN
0.54
Higher 
SECAUCUS
-0.03
Lower
UNION CITY 
1.24
Higher 
WEEHAWKEN
0.6
Higher 
WEST NEW YORK 
0.87
Higher 


Of course, in an attempt to explain these results, some people in Hoboken who identify themselves as "supporters of the public schools" have made claims about the difference in the socioeconomic background between public school students and the rest of the City of Hoboken. This argument holds no real substance. The percentage of students on free or reduced lunch in the Hoboken Public Schools is below 50% and in the elementary grades tested (Grades 3 to 8). Going further into the numbers, when considering the PreK to 8 population (since most 8th grade graduates have been educated in the Hoboken Public Schools since pre-school) the precent of free or reduced lunch is below 50% (see Chart 2). 

Chart 2: 2018-19 Hoboken Data- Enrollment and SES status
CLICK TO ENLARGE 

Nevertheless, because of the SES issue, I asked a researcher at Stanford to comment about how the SES number is derived. What follows is their response along with some additional reference materials. The issues in the Hoboken Public Schools are beginning to gather national attention. People want to know how can these test scores occur when you have 9:1 student teacher ratios, teachers being compensated at salaries far above state and national averages, per pupil spending close to $28,000 per student and so much chatter on social media about how wonderful the schools are doing. People are beginning to notice.... 


Question (Dr. Petrosino): Can you explain in a little detail how the socioeconomic status of the school district was calculated? 

Answer (Stanford Researcher): I looked into how the SES measure was created. The creation of the SES measure is quite complicated, but SES status is essentially a composite created from 6 measures from the ACS survey: median income, proportion of adults with a bachelor’s degree or higher, child poverty rate, SNAP receipt rate, single mother headed household rate, and unemployment rate for each race group (all, white, black, Hispanic) in each of 7-year spans for both the estimates and their standard errors. I put a link to the documentation along with some things that might be useful or helpful, depending on how in-depth of an answer you need.

The link to the documentation:

I've highlighted some things that might be useful: 

1) The exact wording of the all the survey questions for each of the 6 measures are in appendix B of the documentation starting on page 69. 

2) On page 63: is a nice table that shows how each of the 6 measures of the SES composite looks at different standard deviations of the SES composite. 


3) On page 40:  the construction of the SES measures is described in detailed. (This is very technical (imputation, weighting, standard error shrinkage) to create the SES composite.

Additional resources on Hudson County School Districts: 

Sunday, December 15, 2019

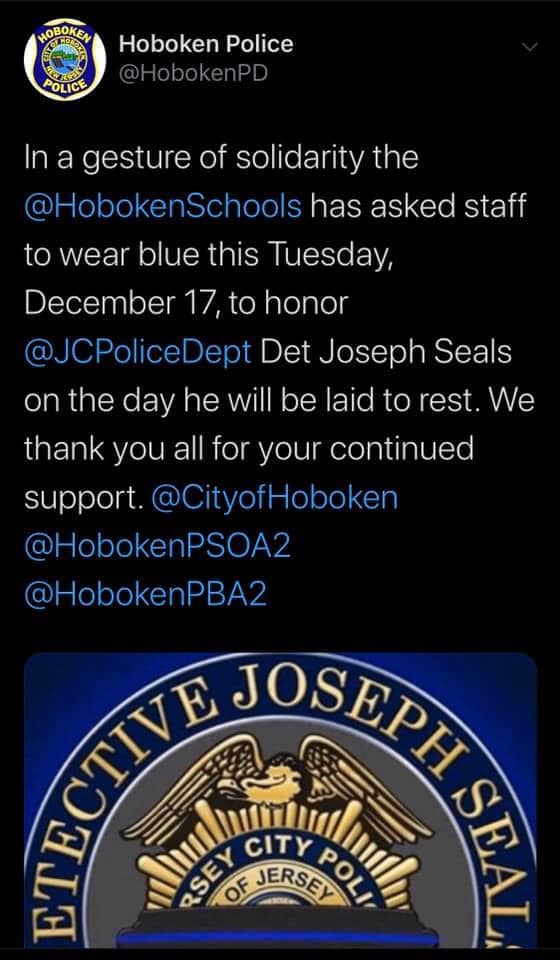
December 17- Wearing of Blue for Det. Joseph Seals

Perhaps in addition to school staff-- if possible-- students can also wear blue in a sign of support and appreciation for Detective Seals on Tuesday, December 17th. -Dr. Petrosino  


Friday, December 6, 2019

Stanford Study Indicates Hoboken District Students Completing Grades 3 to 8 Are FAR BELOW Grade Level Compared to All Hudson County Public School Districts from Similar Socio-Economic Background

Reader Comments Enabled for this post....

An 8th grader educated in the Hoboken Pubic Schools has acquired the education of a student in roughly March of the 6th Grade, 1.27 grade levels below the 8th grade level of students from similar socioeconomic strata. An 8th grader educated in the Union City Public Schools has acquired the education of a student roughly in December of the 10th grade, roughly 1.24 grade levels above the 8th grade for students from similar socioeconomic status. 

I recently created a post centered around a Stanford University report which showed that students educated in the Hoboken Public School completing Grades 3 to Grades 8 are now 1.27 grade level lower than students from similar socioeconomic backgrounds. Note, it is important to remember that this is an "apples to apples" comparison since the students come from similar socioeconomic status.

Thanks to a couple of regular followers, I was asked basically how does the 1.27 grade level lower then students from similar socioeconomic backgrounds compare to other districts in Hudson County?

I thought that was a reasonable question and so I had some colleagues explore the data in greater depth and compiled similar data for Hudson County Public Schools Districts. The results indicate a few things- for instance, a majority of Hudson County School District are doing quite well and their students completing Grades 3 to 8 are scoring well above grade level when compared to students from similar socioeconomic backgrounds.

Unfortunately, the data also indicates just how poor of an education the students completing Grades 3 to 8 in the Hoboken School District are receiving. I presented the data in both tase form as well as in chart form. It is in chart form where we see the extent of how poorly the results are when compared with students from similar socioeconomic backgrounds.

DISTRICT         GRADE LEVELS
BAYONNE0.67Higher 
GUTTENBERG0.06Higher 
HARRISON/E. NEWARK-0.09Lower
HOBOKEN-1.27Lower
JERSEY CITY-0.24Lower
KEARNY0.21Higher 
NORTH BERGEN0.54Higher 
SECAUCUS-0.03Lower
UNION CITY 1.24Higher 
WEEHAWKEN0.6Higher 
WEST NEW YORK 0.87Higher 

These results seem to fly in the face of various declaration and pronouncements of how well the Hoboken Public Schools are doing. These results indicate that there is a systemic problem in the Hoboken Public Schools in the elementary and middle school grade levels. These results seem to indicate that despite one of the highest per pupil expenditures in the State of New Jersey, results lag significantly behind every pubic school district in Hudson County. 

CLICK TO ENLARGE
 What is especially surprising is look at the comparison between Hoboken and Union City. The Union City District has students who are completing Grades 3 to Grade 8 at 1.24 grade levels ABOVE students from districts with similar socioeconomic status. Placed in common terms, an 8th grader educated in the Hoboken Pubic Schools has acquired the education of a student in roughly March of the 6th Grade. An 8th grader educated in the Union City Public Schools has acquired the education of a student roughly in December of the 10th grade. 

The following is the raw data which helped prepare this report: 


Monday, November 25, 2019

Stanford University Report Shows Hoboken School District Students Completing Grades 3 to 8 Are Now 1.27 Grade Levels LOWER than Students with Similar Socioeconomic Status

The Hoboken Public Schools are not improving substantively despite a long term coordinated effort on social media to communicate such a message. In fact, the current data indicates that an 8th grade student educated in the Hoboken Public Schools will be 1.27 grades behind an 8th grader from a similar socioeconomic level school. Put another way, 8th graders in the Hoboken Public Schools are leaving with an education equivalent of that of a 6th grader in the month of March from the same socioeconomic strata. 


The Educational Opportunity Project at Stanford University has built the first national database of academic performance. As the project states,  "the educational opportunities available in a community, both in and out of school, are reflected in students’ average test scores. They are influenced by opportunities to learn at home, in neighborhoods, in child-care, preschool, and after-school programs, from peers and friends, and at school." 

Recall, last year, the analysis by researchers at Stanford University showed Hoboken had the lowest growth rate in Hudson County and was among the lowest growth rather in the State of NJ and the nation. Simply put, for the 2018 report, in the 5 years between Grades 3 to 8, students in the Hoboken School district were advancing only 4.1 grade years. 

The 2019 report indicates that for the years between Grades 3 to 8, students in the Hoboken School district are now advancing 1.27 grades LOWER than districts with similar socioeconomic status. This indicates results have not improved over last year and, in fact have shown decline. 


Thursday, November 21, 2019

Steven Van Zandt Honored at the First Annual Rock and Roll Forever Foundation Gala on Nov 23, 2019

St. Louis Meeting with Rock and
Roll Forever Foundation-2008
Guitarist Little Steven Van Zandt, a New Jersey native, will be honored for his commitment to arts education at the First Annual Rock and Roll Forever Foundation Gala on Saturday, Nov. 23, at the Hard Rock Cafe in New York. 

The award recognizes Van Zandt’s founding of TeachRock, which provides a free, interdisciplinary, arts-driven curriculum for students from kindergarten through 12th grade. The TeachRock lesson plans are used by more than 20,000 registered teachers in all 50 states, including in Middletown.

It was back in August of 2008 when I met with Steven Van Zandth in St. Louis about the Rock and Roll Forever organization. Read more about that meeting by clicking HERE. 

The initial hope that the Hoboken School District would be able to incorporate some of the foundation's curricula materials and course guides into the district's K-12 Arts/Music curriculum material was explored extensively but apparently was never followed up upon after I left the district. 


Wednesday, November 13, 2019

Hoboken Educator Elizabeth Allen Posthumously Named To NJ Hall Of Fame

Former Hoboken Teacher- Elizabeth Allen 
The NJHOF paid tribute to Elizabeth Allen, a longtime educator in Hoboken who rose to become the first woman president of the New Jersey Education Association, naming her posthumously to its ranks as a "Public Service" awardee.
"We are thrilled to see Elizabeth Allen, a fierce, lifelong advocate of public education, recognized for her part in shaping our history," NJEA president Marie Blistan said. "Thanks to her foresight and unrelenting insistence on providing educators with job protection and a pension plan that prevented poverty after retirement, New Jersey has been able to build the best public education system in this county. It is an honor to follow in her footsteps."

"Allen began her 48-year-long teaching career in the Hoboken School District as principal of the elementary school; she held the same role at Hoboken High School. Eventually, Allen transitioned into a position as supervisor of the education of teachers at the Hoboken Normal and Training School. At the age of 28, Allen was named vice-president of the New Jersey Teachers' Association. In this role, she gained recognition as an advocate for the teachers' retirement fund and issues related to teacher tenure. As a result, Allen was often thrust into the public eye and attracted a great deal of controversy because of her persistent and outspoken views."
"In 1896, Allen's hard work reached a pivotal climax when Senator John B. Vreeland of Morristown introduced a bill that provided half-pay annuity to teachers with 20 years of service who were no longer able to fulfill their roles as educators. The fund was to be financed by a one percent pay stoppage from the monthly salary of all those who elected to be considered under the law. Although the bill passed to become the first statewide teacher retirement law, there was more work to be done. Membership for the bill was voluntary, and consequently Allen set out through flyers, speeches and newspaper campaigns to recruit as many members as possible. Ultimately, at the end of three months, Allen and her dedicated team managed to enroll more than half of the state's teachers. She served as secretary of the Teachers' Retirement Fund."


Saturday, November 9, 2019

2019 Hoboken Board of Education Results

Proposed PSE&G Substation- Hoboken, NJ 
HOBOKEN, NJ — Hoboken residents headed to the polls for the 2019 general election on Tuesday, Nov. 5. In addition to statehouse and county races, voters chose representatives on the local board of education.
There were five candidates competing for three seats on the Hoboken Board of Education in 2019. Each term last for three years.
With 98 percent of the districts reported, it appears that - pending official certification - Sheillah Dallara, Alex De La Torre and Joyce Simons have emerged victorious.
According to the Hudson County Clerk's Office, the unofficial results are:

2019 Hoboken Board of Ed Results (99.34% reporting)


303 Willow Avenue- Nov 8, 2019
The terms of current school board members Dallara, De La Torre and Jennifer Evans are expiring. Evans withdrew from the 2019 race after previously filing a petition to run.

De La Torre, Simons and Dallara ran together on the "3-4-5 For Hoboken School Board" slate, which gained the endorsement of Mayor Ravi Bhalla.

Gursahani ran as an independent candidate, aligning her campaign with Bautista's.
Waiters previously competed for a seat on the Hoboken Board of Education, running with the slogan "Education Before Politics" in 2018.

    Thursday, November 7, 2019

    Hoboken Middle School Falls to Lowest 5% of All Public Schools in New Jersey - Lowest NJ Department of Education Rated School in Hoboken


    Hoboken Middle School, Hoboken NJ 

    How low can Hoboken Middle School NJDOE ratings plummet until they are discussed openly and publicly ? Is this what the community receives for $27,899 per student? Is this what is meant by "continued improvement" or in "moving the public schools forward"? 

    Numerous administrative turnover, inept district leadership, and failed instructional strategies have led to the Hoboken Middle School not only scoring the lowest in Hoboken but scoring among the lowest NJDOE rated schools in the State of New Jersey (including charter schools- see list below). 

    Is there a plan for Hoboken Middle School other than making Brandt a second middle school for Hoboken and making it the "white" middle school? Why does Hoboken Middle School continue to fail to adequately educate Hoboken's poor, minority, and black and brown populations? (see Chart 1 and Chart 2 below)

    Here are NJDOE scores (0-100) that were reported in March of 2019. The NJDOE ratings were established to comply with the federal Every Student Succeeds Act (ESSA). 
    How the NJDOE Ratings are calculated: Elementary and middle schools: English language arts growth (20 percent), math growth (20 percent), progress toward English language proficiency (20 percent), English language arts proficiency (15 percent), math proficiency (15 percent), chronic absenteeism (10 percent)
    NJDOE Rating for Hoboken Middle School- March 2019 

    NJDOE Ratings for all of Hoboken Public Schools: 
    • HOBOKEN DUAL LANGUAGE CHARTER SCHOOL, HOLA HOBOKEN DUAL LANG CS, CHARTERS 70.63
    • HOBOKEN CHARTER SCHOOL, HOBOKEN CS, CHARTERS 64.25
    • ELYSIAN CHARTER SCHOOL OF HOBOKEN, ELYSIAN CS OF HOBOKEN, CHARTERS 61.86
    • THOMAS G. CONNORS, HOBOKEN CITY, HUDSON 41.85
    • HOBOKEN HIGH SCHOOL, HOBOKEN CITY, HUDSON 38.78
    • WALLACE ELEMENTARY SCHOOL, HOBOKEN CITY, HUDSON 35.79
    • HOBOKEN MIDDLE SCHOOL, HOBOKEN CITY, HUDSON 15.89

    Chart 1: 2018-19 Percentage of White Students- Hoboken Public Schools 

    Chart 2: 2018-19 Percentage of FRL Students- Hoboken Public Schools