Monday, February 27, 2017

Lucero, Petrosino, and Delgado (2017) Exploring the Relationship Between Secondary Science Teachers’ Subject Matter Knowledge and Knowledge of Student Conceptions While Teaching Evolution by Natural Selection

Figure 1: Journal Rankings
Click to Enlarge
Recently, two colleagues and myself published an article in the Journal of Research in Science Teaching (JRST). The Journal of Research in Science Teaching, the official journal of NARST: A Worldwide Organization for Improving Science Teaching and Learning Through Research, publishes reports for science education researchers and practitioners on issues of science teaching and learning and science education policy. Scholarly manuscripts within the domain of the Journal of Research in Science Teaching include, but are not limited to, investigations employing qualitative, ethnographic, historical, survey, philosophical, or case study research approaches; position papers; policy perspectives; critical reviews of the literature; and comments and criticism. It is currently the third highest ranked journal in the field (see Figure 1). -Dr. Petrosino 

Abstract: The fundamental scientific concept of evolution occurring by natural selection is home to many deeply held alternative conceptions and considered difficult to teach. Science teachers’ subject matter knowledge (SMK) and the pedagogical content knowledge (PCK) component of knowledge of students’ conceptions (KOSC) can be valuable resources for helping students learn difficult science concepts such as natural selection. However, little research exists that explores the relationship between science teachers’ SMK and their KOSC on evolution by natural selection. This study explores the relationship between SMK and KOSC through the participation of four biology teachers at a single high school and thus deepens our understanding of the teacher knowledge base. Main data sources are teacher interviews in which each teacher answered SMK-type questions and predicted what their students’ most common alternative conceptions were by using the Conceptual Inventory of Natural Selection (CINS). Other data sources include student responses on the CINS and classroom observations. Findings revealed relative independence between SMK and KOSC, although there is likely a minimum threshold of SMK to recognize student alternative conceptions. However, our work also revealed ways in which teachers were not leveraging their KOSC and suggest potential avenues for future inquiry. # 2016 Wiley Periodicals, Inc. J Res Sci Teach 54: 219–246, 2017 Keywords: pedagogical content knowledge; subject matter knowledge; teacher knowledge of student conceptions; evolution; natural selection

Sunday, February 26, 2017

JOYCE TYRELL - Hoboken High School Teacher, Principal of Our Lady of Grace School, Active Hoboken Citizen

Joyce Tyrell
JOYCE TYRELL HOBOKEN Joyce Tyrell of Hoboken died Wednesday, February 22, 2017. She was 84. Born in Hoboken, Joyce was a lifelong resident. Mrs. Tyrell was a graduate of Montclair State University where she received a Bachelor of Science in mathematics and a minor in music. She then earned her Masters Degree from Montclair in mathematics. Joyce taught in the Hoboken school system and was chairwomen of the mathematics department for grades K-12. She also taught Computer Science at Keane College and was a Principal of Our Lady of Grace Grammar School. Joyce served on the Hoboken Planning Board and theHoboken Historic Commission. Joyce is predeceased by her parents Joseph Tyrell and Johanna (nee Hopf). She is also predeceased by her brother Jack Tyrell and sister Dorothy Richards. She is survived by her nephew George Richards. Friends will be received at the Earl F. Bosworth Funeral Home, 311 Willow Ave., Hoboken on Sunday from 4-8pm. The Funeral Mass will be held at Our Lady of Grace Church, Hoboken on Monday, February 27th at 9:30am. Entombment to follow at Clove LeafMemorial Park in Woodbridge NJ. EARL F. BOSWORTH FUNERAL HOME 311 WILLOW AVE HOBOKEN , NJ 07030 (201) 659-1455 - See more at: http://obits.nj.com/obituaries/jerseyjournal/obituary.aspx…. (RIP) Miss Joyce Tyrell.


Thursday, February 23, 2017

Resilience to Change- Expert Blind Spot Among Preservice and Inservice Teachers: Beliefs About Algebraic Reasoning and Potential Impact on Engineering Education

The following is a final draft of a paper that will be submitted for publication within the next few months and will also be presented at a national conference focusing on engineering education, algebraic learning and teacher preparation. I'm writing with a colleague of mine from the University of Michigan.  In this study, we examine the differences in teachers’ held perceptions about algebraic representational problems (symbolic, word, and story) between pre-service and in-service teachers participating in a teacher education program. Further, I explore further the expert blind spot in algebraic teaching and its implications for K-12 engineering education and the STEM pipeline.-Dr. Petrosino

Friday, February 17, 2017

Michele Russo- August 7, 1949 - February 16, 2017

My sincere condolences to the Russo family, to Anthony Sr, Nicky, Michael, Anthony Jr, on the passing of their Wife/ mother Michele Russo and to the DeStafano family. Mrs. Russo was a tireless advocate and supporter for the children of Hoboken. Michele sponsored Hoboken Recreation Cheerleaders, Ragamuffin Parade, Summer Olympics, Senior Flower Program, Hoboken's Haunted House, Movies Under the Stars, Concerts in the Park, all with pure heart and soul. She was a relentless volunteer for anyone who needed help, you wanted her on your side. Michele's generosity has been recognized throughout the city, by all the countless people in need. 


IN LOVING MEMORY
MICHELE RUSSO
Michele Russo (née DeStefano), born and raised in Hoboken, NJ died on February 16, 2017 surrounded by Family.
Born on August 7, 1949 to Mary and Pasquale DeStefano, Michele Russo is survived by her husband, former Hoboken Mayor Anthony Russo, son Nicholas (Nick) S. Russo, his wife Olivia and children Jenna Rae, Anthony Evan, Lucien Thomas and Nicolo James; son Hoboken Third Ward Councilman Michael S. Russo, his wife Lisa and children Lia Grace and Jack Anthony; and son Hoboken Police Officer Anthony P. Russo, his wife Aliesette and daughter Ava Liana; her brothers Anthony and George DeStefano, and a number of nieces and nephews.
Renowned as a hard working civic volunteer and community leader, Michele’s dedication to Hoboken flourished in the 1990’s as a founder and Coach of the Hoboken Devils Recreation Cheerleaders, now Hoboken Cheer Dynamics.  Also, with the establishment of the Anthony Russo Civic Association, Michele Russo led the effort to “Turn the Tide”, becoming “First Lady” of Hoboken from July 1993 through June 2001.
Michele’s life and commitment to her beloved City of Hoboken brought decades of service as an elected School Board Trustee, Chairwoman of the Hoboken Democratic Organization, Hoboken Parking Authority Commissioner, Board Member of HOPES and organizer of the annual “Hoboooken Haunted House” and countless other community events.
Michele Russo was a loving mother, sister, grandmother, aunt and wife of 45 years.
Public Visitation - Monday, February 20th - 2:00 PM to 9:00 PM at Failla Memorial Home, 533 Willow Avenue, Hoboken.
Mass - Tuesday, February 21st - 10:00 AM at St. Francis Church, 308 Jefferson Street, Hoboken.
In lieu of flowers, memorial contributions to her home parish of St. Francis Church in Hoboken or her founding quest Hoboken Cheer Dynamics. Envelopes will be provided at the funeral home.

Monday, February 13, 2017

February 2017: Full Detailed Agenda Hoboken Board of Education

We Will Not Give Up- Roc Strong 


Tuesday, February 14, 2017
AGENDA
 HOBOKEN BOARD OF EDUCATION
158 FOURTH STREET, HOBOKEN, NJ 07030
(MEETING HELD IN DEMAREST AUDITORIUM, 158 FOURTH STREET, HOBOKEN, NJ 07030)

7:00 P.M.

Friday, February 10, 2017

Answers to Questions About Choice Students in the Hoboken School District: 166 (total) and 120 of 458 (HHS)

Quick Summary: The latest available NJDOE data indicates there are 166 choice students in the Hoboken School District. Additional data indicates 26% of high school enrollment in Hoboken High School are choice students. 

As regular readers will recall, the Hoboken School District is a receiving district for "choice" students from the surrounding area. But just how many students are there in Hoboken who are "choice" students and how many of them are enrolled in the high school. A fairly simple and straight forward question but one that is not very easy to ascertain. I have received a number of inquiries over the past few days concerning these questions and though that if a few people are interested, perhaps there are many more. 


This post will answer 2 questions. First, how many "choice students" are in the Hoboken School District. Second, what percentage of enrolled students in Hoboken High School are choice students? 

Question 1: The graph below is pretty straight forward and not only shows the number of choice students for the most recent school year (166) but also shows the continued rise of choice students since the 2009-10 school year. 

Chart 1: Number of Choice Students in Hoboken District
2009-10 to 2015-16
CLICK TO ENLARGE

Question 2: The second question is how many choice students are in Hoboken High School. I have include some of my data sources (see Chart 2 and Chart 3). According to the latest data, there were 458 total enrolled students in Hoboken High School with 120 of them being "choice" students. Therefore, based on the latest data, roughly 26% of the students in Hoboken High School are non-residents or "choice" students. 

Chart 2: 2015-15 Enrollment District Data- Hoboken School District

Chart 3: Disaggregated Choice Data by Grade 2015-16 School Year 

Comment: While a district cannot "pick and choose" all choice students, the district Board does control the number of choice students admitted to the school district as long as the number admitted is within the upper limit of state approved slots for the district. There is also no available analysis that I know of currently that has examined choice vs resident students on any specific measures. 


February 10, 2017- Hoboken Waterfront 

Monday, February 6, 2017

Free or Reduced Lunch Population Steadily Declines from 86.30% in 1998-99 to 52.55% in 2015-16 for Hoboken Public School District

Figure 1: 1998-2016 Free or Reduced Lunch Percentage
CLICK TO ENLARGE
The percentage of students identified as qualifying for Free or Reduced Lunch has declined from 86.30% in 1998-99 to 52.55% in 2015-16 for the Hoboken School District. 

According to Merrian-Webster dictionary white flight is the departure of whites from places (as urban neighborhoods or schools) increasingly or predominantly populated by minorities. Perhaps a more expansive approach to "white flight" might include socioeconomic status or class after all sometimes people use the term "white" as a euphemism for other conditions (class, income) which we may feel uncomfortable discussing. 

So, are charter schools having a segregative impact on the Hoboken Public Schools causing "white flight" as claimed by a number of Hoboken Board of Education members and realized in terms of an exodus of non-free or reduced students (a.k.a. "middle class")?

The short answer is that over the past 18 years the percentage of students identified as qualifying for free or reduced lunch has declined from 86% to 53% (see Figure 1). 


BACKGROUND: Over the past weeks I have received inquiries concerning the Free and Reduced percentages for the Hoboken School District. As many of you pointed out, the data I reported was from 2013-14 and was the most current available from the informative Eduction Law Center website. I have since done additional research and found more updated numbers for the 2015-16 school year. The updated percentages are similar and statistically not very different to 2013-14. I also decided to do a more longitudinal analysis and now have date for the past 18 years. 

For 2015-16 there were a total of 1943 students in the district and 1021 received either free or reduced lunch. This means the percentage of FRL students for 2015-16 in the Hoboken School District was about 53%. 

Figure 2: 2015-16 Hoboken City Enrollment Data
CLICK TO ENLARGE 
Recall, in 2013-14 the percentage as reported by the Education Law Center was 49%. 

Figure 3: 2013-14 Hoboken City FRL Percentages
CLICK TO ENLARGE

I did some additional research and looked up some archival data. 

For 2005-06, about a decade ago, there were a total of 1900 children in the school district and 1491 qualified for either Free or Reduced Lunch. This means the percentage of FRL in 2005-06 in the Hoboken School District was about 78.47%

Figure 4: 2005-06 Hoboken City Enrollment Data
Click to Enlarge
For 1998-99, the oldest data I could find fairly quickly, there were 2625 children in the school district and 2266 qualified for either free or reduced lunch. This means the percentage of FRL students for 1998-99 in the Hoboken School District was about 86.32%

Figure 5: 1998-99 Hoboken City Enrollment Data
Click to Enlarge 

After finding the 1998-99 data I thought it would be interesting to gather data for EACH year in order to get a more fine grain look at the data over a long stretch of time-- in this case, 18 years. This also compliments an analysis I did previously where we looked at the percentage of students identified as "white" in the Hoboken School District. 

Summary: "White flight" and segregative impact may be a challenge to convince open minded people and independent third parties when data indicates the percentage of white students have been on an 18 year rise (from @15% to 33%) AND the percentage of students from families meeting criteria for free or reduced lunch have declined significantly (from 86% to 53%) over the same time period in the Hoboken School District. 


“they’re (charter schools) fostering white flight, and they’re bankrupting us,” the city’s school board head charged in a Wednesday interview. “We are creating separate but equal school systems,” warned Hoboken Board of Education president Leon Gold -Salon (3/14/14)

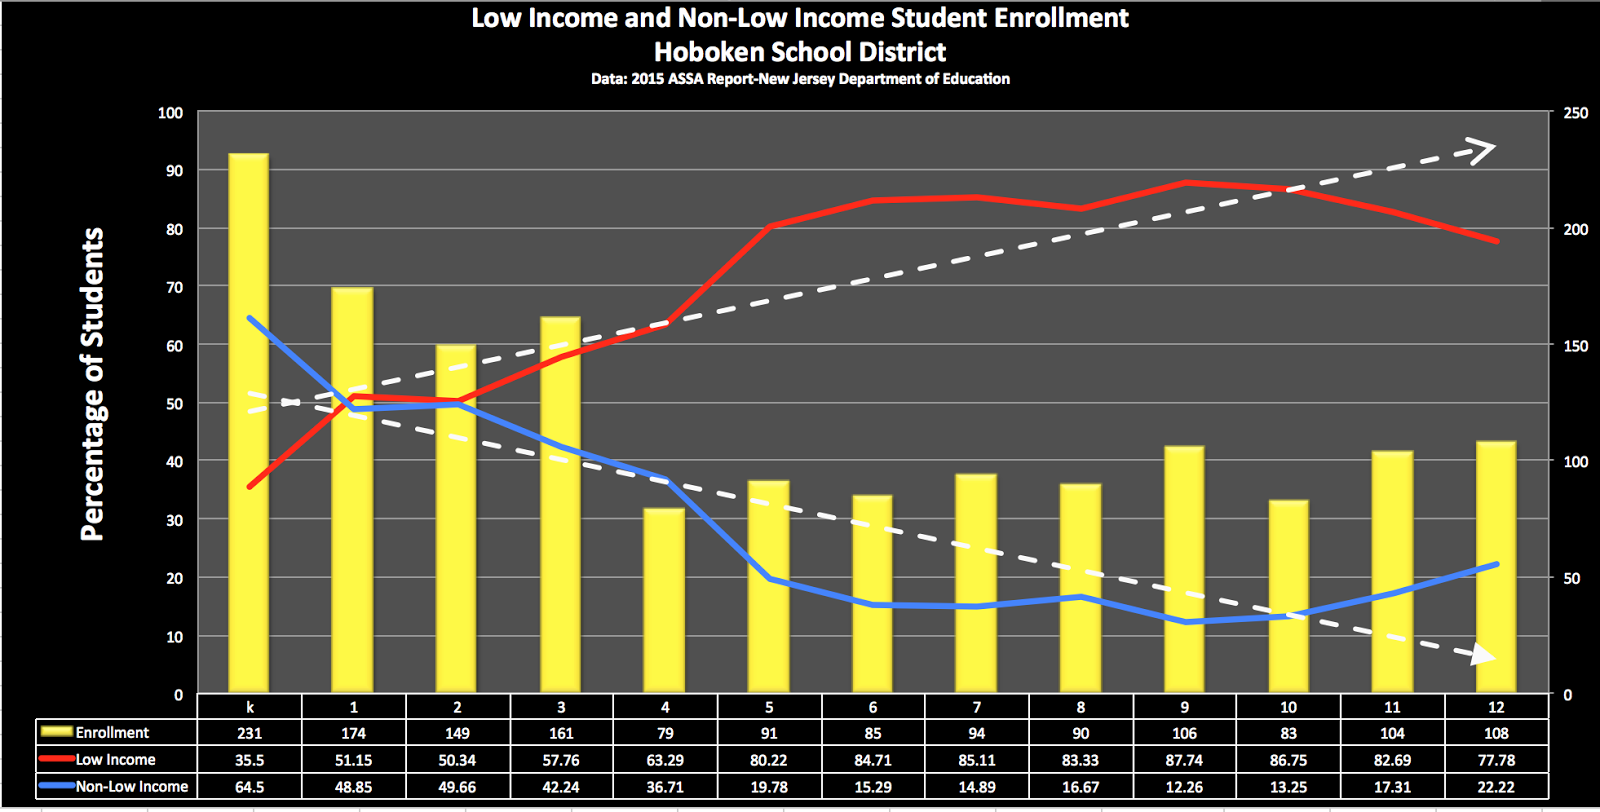
Further Clarification: Some regular readers of this blog pointed out that further clarification might be needed. I agree. It is important to understand that this data on Free or Reduced Lunch eligibility (Figure 1) is at the full district level and not disaggregated. Grade by grade analysis (i.e. disaggregated)  reveals different and also concerning trends of the Hoboken School District's inability to retain the non Free or Reduced eligibility population of students it has enrolled in the early grades (Figures 6 and 7 below). In short, the students categorized as non Free or Reduced Lunch eligible are primarily, although not exclusively, in the early grades. What percentage of the non Free or Reduced eligibility population of students that have left the Hoboken School District are also considered white is an interesting question but outside the focus of this particular post.

Figure 6- Example of disaggregated data

Figure 7- Example of disaggregated data


Thursday, February 2, 2017

White Flight Not Evident in 18 Year Longitudinal Analysis of the Hoboken Public School District Despite Claims by Advocates

Figure 1: Percentage of Students Defined as White in
Hoboken School District (1998-2016)
Click to Enlarge
According to Merrian-Webster dictionary white flight is the departure of whites from places (as urban neighborhoods or schools) increasingly or predominantly populated by minorities. 
Are charter schools having a segregative impact on the Hoboken Public Schools causing "white flight" as claimed by a number of Hoboken Board of Education members? 


One way to determine if white flight is taking place is to document the decrease in white students in the school district. It would make sense that if white flight was occurring, white students would be leaving the district and would be making up a smaller and smaller percentage of the student enrollment in the district. 

When we look at the data over an 18 year span, we find the percentage of students designated as white is actually increasing in the Hoboken Public School District...and significantly(!)

In fact, the percentage of white students in the Hoboken Public School District has risen from 14.98% in 2000-01 to 33.2 % in 2015-16- an increase of over 120%. Moreover, since the Hola Dual Language School was founded in 2010-11 the percentage of white students in the Hoboken School District has risen from 22% to 33%.

The trend line (dotted arrow- Figure 1) clearly shows the percentage of white students in the Hoboken Public School District has been on the rise for the past two decades with no evidence of a plateau. White flight, as measured by the decline in the percentage of white students in the Hoboken School District, is not taking place in the Hoboken School District and in fact, has seen a steady increase since 1998-99. 

CLICK TO ENLARGE


Monday, January 30, 2017

Petrosino, A. J. and Mann, M. J. (2017) Pre-Service Teacher's Knowledge

The following is some work I have been working on for the past number of months. The initial work (poster session) for this will be presented at a conference in Belton, TX in March-- a more extensive and detailed presentation will be made at the American Educational Research Association Meeting in April and -- a draft for publication should be completed somewhere between those who meetings. The results are a little surprising and should be of interest to a number of policy makers, teacher educators, and educational psychologists. We are currently collecting more data this semester which will not be included in the previously mentioned work but will hopefully help us understand this phenomena with a little more clarity. -Dr. Petrosino 


Petrosino, A. and M. J. Mann (2017). Pre-Service Teacher's Knowledge. 


ABSTRACT: This research evaluates the science content knowledge of 133 pre-service teachers with a high disciplinary content background and good pedagogy background (HDB), 121 pre-service teachers with a typical college disciplinary background and high pedagogy background (TDB) and a subpopulation of the university population of 100 students with typical college disciplinary background and no pedagogical background (TDPB). The participants took a survey of released science Praxis questions. A pairwise comparisons were performed using Dunn's (1964) procedure with a Bonferroni correction for multiple comparisons and an effect size was determined. Earth science questions revealed statistically significant differences between the TDB(Mdn=24.00) and HDB(Mdn=25.00) (p=.017) but not between the TDPB(Mdn=25.00) or any TDPB group combination. Science processes questions revealed statistically significant differences between the groups TDB(Mdn=15) and HDB(Mdn=17) (p=.002) and between TDPB(Mdn=15) and HDB(Mdn=17) (p=.000) but not between the TDPB(Mdn=15) and HDB(Mdn=15). Life sciences questions revealed statistically significant differences in groups between the TDB(Mdn=22) and HDB(Mdn=26) (p=.000) and between TDPB(Mdn=24) and HDB(Mdn=26) (p=.000) but not between the TDPB(Mdn=24) and TDB(Mdn=22) and physical science questions revealed statistically significant differences in groups between the TDB(Mdn=33) and HDB (Mdn=35) (p=.000) and between TDPB(Mdn=30) and HDB(Mdn=35) (p=.000) but not between the TDPB(Mdn=30) and TDB(Mdn=33). Students from a program which emphasized high disciplinary knowledge scored best on content and pedagogy questions. Students with no STEM or education major scored as well and sometimes better than the group of students with typical disciplinary content and high pedagogical content knowledge and less than the high disciplinary knowledge students.

Friday, January 27, 2017

International Holocaust Remembrance Day 2016

On this International Holocaust Remembrance Day, I find myself reflecting on efforts the Hoboken Curriculum Committee and I put toward a full curriculum to help educate the children of the Hoboken Public Schools about the Holocaust (Link 1, Link 2, Link 3, Link 4, Link 5, Link 6, Link 7). This effort included coordination and communication with the NJ Commission on Holocaust Education. A wonderful group of committed educators dedicated to informing the children of the state about the Holocaust and the atrocities of genocide, prejudice, and bulling.

The core mission of the New Jersey Commission on Holocaust Education is to promote Holocaust education in the State of New Jersey. On a continual basis, the Commission shall survey the status of Holocaust/Genocide Education; design, encourage and promote the implementation of Holocaust and genocide education and awareness; provide programs in New Jersey; and coordinate designated events that will provide appropriate memorialization of the Holocaust on a regular basis throughout the state. The Commission will provide assistance and advice to the public and private schools and will meet with county and local school officials, and other interested public and private organizations, to assist with the study of the Holocaust and genocide.

For more information on the NJ Commission on Holocaust Education please: CLICK HERE  

Yad Vashem- The World Holocaust Remembrance Center


Sunday, January 22, 2017

Under Kids First and Kids First legacy Majority Leadership- Hoboken High School Graduation Rate Falls Below NJ State Average for 6th Consecutive Year- 2016 Graduation Rates for All Hudson County's Public High Schools

For the sixth consecutive year the Hoboken Public Schools under the Kids First and Kids First legacy Board leadership (i.e. "Forward Together") produced a high graduation rate below the New Jersey state average.

NJ.COM is reporting that three Hudson County public high schools -- McNair Academic, Infinity Institute and Liberty -- had perfect graduation rates last year, according to data released on January 12, 2017 by the NJ state Department of Education (DOE).

Research shows that low graduation rates correlate with dropping out of high school which has documented impacts on income, incarceration, single motherhood, and public resources (see IN DEPTH section at end of this article). 
For the sixth consecutive year under Kids First and Kids First legacy district leadership, the Hoboken School District (HHS) recorded a high school graduation rate below the NJ state average. This coincides with concurrent failure over the same time period in the QSAC DPR in Instruction and Program, elevated rates of violence and vandalism compared to county and state averages, multiple school and district configurations, and very low scores on the PARCC exams. Further analysis of the 2016 High School graduation data (see Figure 1) indicates an 83.3 graduation rate for economically disadvantaged students at Hoboken High School .

Data: http://www.state.nj.us/education/data/grate/2016/
Figure 1: 2016 Hoboken High School Graduation Rates-Dissagregated
CLICK TO ENLARGE  
NJDOE website for High School Graduation Rate: CLICK HERE 
The state average graduation rate is 90.1 percent, up from 89.7 last year, NJDOE officials said.
Want to know more about the impact of dropping out of high school? Please click here to see 11 interesting facts and things you can do: CLICK HERE
Snyder High, which has the lowest graduation rate in the county and saw a dip in graduation success -- from 56 percent in 2015 to 50 percent this past school year, according to the DOE statistics.

Here are the graduation percentage rates for public high schools in Hudson County for the 2015-16 school year:
School                     %
**Academic McNair   100
**Infinity Institute       100
**Liberty                    100
*High Tech                 99
*County Prep             99
Harrison                     95
Secaucus                   94
NJ State Avg             90.1
Kearny                       90
Weehawken               90
Bayonne                    86
Hoboken                   86

Hoboken                   83.33 (economically disadvantaged rate) 
North Bergen             83
Memorial                   83
Union City                 80
**Dickinson               78
Jersey City                75 
**Ferris                     75
**Lincoln                   69
**Snyder                   51
* -- High Tech and County Prep are part of the Hudson County Schools of Technology, which include a number of academies. The graduation rate for the HCST district is 93 percent.
** -- These schools make up the Jersey City district high schools. The graduation rate for the entire district is 75 percent.


Income- Perhaps the most widely discussed consequence of not finishing high school is its impact on income potential. Students who drop out of high school earn significantly less than their peers who graduated from high school.

Incarceration- Dropouts are also more likely to be incarcerated in prison. According to a study by the Center for Labor Market Studies, high school dropouts are more than 63 times more likely to be incarcerated than four-year college graduates and more than six times more likely to be incarcerated than those with only a high school diploma. 

Single Motherhood- Single motherhood is both a cause and a consequence of not finishing high school. Among women aged 16 to 24, high school dropouts were the group most likely to be single mothers, with 22.6 percent of this group being single mothers.

Public Resources- Because high school dropouts earn less income, are more likely to be incarcerated and become single mothers at disproportionate rates, they use more public resources. According to a study by the Alliance for Excellent Education, increasing the male high school completion rate by just 5 percent would save the nation $4.9 billion in crime-related expenses. Likewise, if all students graduated, incomes would increase, and reliance on a program like Medicare would be reduced enough to save the nation $17 billion.

2016 State HS Graduation Rate: 90.1%; Hoboken Graduation Rate: 86.0%
2015 State HS Graduation Rate: 89.67%; Hoboken Graduation Rate: 83.33%
2014 State HS Graduation Rate: 88.6%; Hoboken Graduation Rate: 86.78%
2013 State HS Graduation Rate: 87.5%; Hoboken Graduation Rate: 85.43%
2012 State HS Graduation Rate: 86.46%; Hoboken Graduation Rate: 74.53%
2011 State HS Graduation Rate: 83.17%; Hoboken Graduation Rate: 81.99%

Tuesday, January 17, 2017

Hoboken Board of Education - January 17, 2017 Detailed Agenda