"With more than a 99% certainty we can state that data indicates there is no statistical difference between the percentage or number of students identified as SPED between the traditional pubic schools and charter schools in Hoboken, NJ. when accounting for enrollment. In other words, counter to some claims, neither the traditional public nor the public charters are educating special education students at a differing proportion in the City of Hoboken, N.J."
While I have not done an analysis on this issue at a large scale (county, state, national), I would like to point to a unique case in Hoboken, NJ which I have conducted. Hoboken is unique in that it has a traditional public school system with 6 schools (Brandt, Calabro, Conners, Hoboken HS, Hoboken Middle School, and Wallace) and three charter schools all within a square mile (city population approximately 53,635 people). Approximate student enrollment of the traditional Hoboken public school district is 1778 K-12 students. Approximate student enrollment of the three charter schools in Hoboken is 763 K-12 students (source NJDOE). Preschool (a.k.a. "PreK") was excluded from this analysis for two main reasons: 1) not all schools involved in this study have a preschool component and 2) lack of data at the preschool level. It was decided to pool enrollments into two basic categories ("traditional public" and "public charters") rather than conduct separate analysis on all possible permutations and combinations in order to better address the overarching educational policy question.
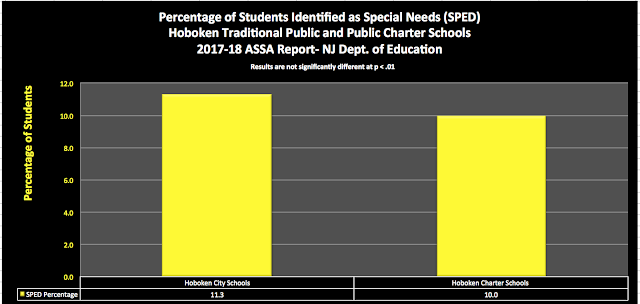
According to the most recent data available (see Figure 1), 11.3% of the students enrolled in the Hoboken Public Schools are officially identified as SPED and 10.0% of the students enrolled in the three charter schools in Hoboken are identified as SPED.
This analysis simply looks at the enrollment number reported in the NJDOE ASSA report and not the nature of a classification, severity of a classification, or economic considerations of classifications. Rather, this particular analysis addresses the national, state and local level perception that charter schools do not enroll any SPED students and thus simply the number and percentage of enrolled SPED students are discussed. Further analysis on severity of classification and/or economic considerations certainly deserve attention and warrant discussion and would add to the current analysis.
 |
| Figure 1: Percentage of Students Identified as Special Needs Hoboken Traditional Public and Public Charters (2017) CLICK TO ENLARGE |
Statistical Analysis
In order to see if the proportion of SPED students in the charter schools differs significantly from the portion of SPED students in the Hoboken public schools, a chi-square test was employed. A chi-square goodness of fit test allows us to test whether the observed proportions for a categorical variable differ from hypothesized proportions (see Figure 2).
I used the highest standard commonly used in social science research- a p-value of .01. A p-value of less than .01 would indicate that the proportions of special education students in the charter schools differed significantly from the proportion of special education students in the public school. For the question of whether there is a significant difference between the percentage of special education students in traditional public and public charter schools in Hoboken, NJ the chi-square test statistic was .9931, p=.319. Since the p value is greater than .01, these results show that the proportion of SPED students in the charter schools does not differ significantly than the proportion of SPED of students in the public schools.
Additional statistical analysis was performed which included public school students attending other schools or school districts for special accommodations (identified as "SENT" on ASSA report). In one case the model was: On Roll (Full) + Sent (Full) and in another model we used On Roll (Full) + Sent (Full- only SPED). In both models additional statistical tests found no significant statistical differences at the .01 level between Public Schools and Public Charter Schools in Hoboken in number or percentage of SPED students when accounting for enrollment.
 |
| Figure 2: Chi-Square Contingency Table CLICK TO ENLARGE |
In fact, all three models:
Model I: On Roll-Full vs Charter Schools;
Model II: On Roll-Full + Sent-Full vs. Charter Schools; and
Model III: On Roll-Full + Sent-Full (SPED only) vs. Charter Schools)
indicate no significant statistical difference between the Hoboken Public Schools and the Hoboken Charter Schools in terms of number or percentages of students identified as SPED enrolled in school.
Discussion
These percentages indicate that at least in Hoboken, NJ the traditional public schools and the public charter schools are educating the same percentage and number of students identified as in need of qualifying for special education services when accounting for enrollment. The proportions do not differ. In addition, these findings are extremely robust and tolerant of some variation in population estimates.
Again, it needs to be emphasized that these numbers are accurate for Hoboken, NJ and its unique situation and may or may not be representative of larger county, state, or national data.
Acknowledgements
I would like to thank the many regular readers of this blog who have requested this analysis and prompted me to undertake this project. I hope these findings will assist at both the local level and potentially add to the larger county, state and national conversation of this very important topic. Thank you also to a number of comments I received on this original posting via email, texts, and on social media. These comments helped in better articulating and refining the discussion and analysis of this post.
References
Preacher, K. J. (2001, April). Calculation for the chi-square test: An interactive calculation tool for chi-square tests of goodness of fit and independence [Computer software]. Available from http://quantpsy.org.
note1: a more involved and academic analysis of special education enrollment in Hoboken, NJ and the issue of funding for charter vs traditional public schools will be presented at an upcoming national educational research conference.
note2: data from 2017-18 ASSA Report Hoboken City Schools
Data Supplement


No comments:
Post a Comment