Sunday, March 23, 2014

Ecosystem in a Bottle Lesson - TerrAqua Investigation Column

Ecosystems in a Bottle
The following is a activity conducted with pre-service teachers in Elementary Science. The activity revolves around the creating and subsequent monitoring of a dual ecosystem. This activity has been very successful in class and has provided many opportunities to point out to pre-service teachers issues of inquiry, observation, data recording, interdependence, sustainability, photosynthesis, water cycle, and other science process and content areas. 

As an additional activity students have been asked to keep a blog on their weekly observations. These blogs have allowed for multimedia, descriptions, drawings, and opportunities to share their observations with colleagues, practicing teachers, mentors, students, and to be a part of their permanent "teaching portfolio." 

Topic: Ecosystem Dynamics 
Learning Objective: Students experience the fragile balance of an ecosystem, how different components interact, and how different inputs impact the system. 
Exploration Phase: 
Hands-on Activity: Build a TerrAqua investigation column, fill it with soil, plants and water, and observe and record changes over time (Materials and procedure below). 
Exploration through Media: Video 
Introduction the Ecosystem Services Review: http://www.youtube.com/watch?v=HbU41UhnWN8 
Concept Development Phase: Concepts to be taught: Ecosystem dynamics, systems thinking, human impacts on ecosystems, biodiversity, energy flow in an ecosystem, pollution and waste, recycling/reuse, and ecosystem services. 
Procedures to be taught: Inquiry, experimental design, monitoring a dynamic system through careful observation, and detailed data recording 


Blogs on the Dual Ecosystems
http://ecosysteminabottle.weebly.com  (DC and NM )

http://closedecosystemanjm.blogspot.com (JM, AS, NA, MB) 

http://squishy-ecoworld.tumblr.com (Ana, Marysela and Claudia) 

http://bobandfelix-ecosystem.tumblr.com (AH, Holy)

http://bcjecosystems.blogspot.com/ (BG)

http://spring2014ecosystem.blogspot.com (KI, Melissa)


LINK TO ACTIVITY: CLICK HERE

Wednesday, March 19, 2014

Under Kids First and Superintendent Toback- Traditional Hoboken Public School SAT Composite Scores Lower than Expected Based on National Family Income Estimates

CLICK TO ENLARGE
Note: I would like to acknowledge and thank a number of anonymous bloggers and colleagues who have provided useful data, readings, perspectives, url's, and analysis on this topic. Edits have been made to the original post on 3/23 and 3/24 and now include the use of Cohen's d, effect size, links to free lunch (FL) and free and reduced lunch (FRPL) criteria, deleting of county comparisons (the FL% when including any of the charter schools within the district's borders), explanation of some assumptions, an alternative one-tailed t test analysis, and modifications to some of the original text. 

It has become popular to have the public expect less from schools and districts that educate students from families with lower than average socio-economic status (SES). Indeed, there is research and data that support the fact the there is a high correlation between SES and national tests like the SAT. Recently, a report was released that outlined very specifically the correlation of SES and the SAT. And, as one might expect, as family income increases so too does SAT scores (reading, math, writing, total or composite-see diagram). Using these numbers and charts, we can find an "expected" SAT score for each of 10 socio-economic categories. If a district's scores are higher than expected, we can reasonably  assume something good is going on. Students are performing at levels higher than expected by socio-economic status alone. Conversely, if a district's SAT scores are lower than expected by socioeconomic status, we can reasonably assume there are factors working against student success within the school/district etc.

As an example, let us look at the Hoboken School District in Hoboken, New Jersey. According to latest figures, the free lunch percentage (as opposed to "free and reduced percentage") for the Hoboken School District shows Hoboken High has 592 students; 411 qualify for Free Lunch, which is about 69% (about 81% for FRPL). The district FL% is about 64%.  Some researchers like free lunch and have said that "free lunch" is a better indictor of poverty on academic performance than "free and reduced" while others prefer the "free and reduced" percentages. 
For income eligibility guidelines please click here
For New Jersey: Click Here
For federal income eligibility guidelines for July 1, 2012 - June 30, 2013 please CLICK HERE
Click to Enlarge
If we look at the LOWEST income category ($0- $20,000) we notice that we would expect a school district with students from this category to receive a Total SAT score of 1326. If we look at the second lowest income category ($20,000-$40,000) we would expect students from this demographic to receive a Total SAT score of 1402. Hoboken scores a SAT Total score of 1192. The majority of students in the Hoboken School District who take the SAT certainly fall somewhere in the lowest and second lowest categories. Some assumptions/estimations have been made including a national population of about 300,000 (based on the Washington Post article) and a local population of about 50. From published data, the standard deviation for the SAT composite is 319 and was used for all analyses. It is possible that the standard deviation locally differs from 319 but not clear whether that difference would be above or below the national standard deviation for the SAT composite score. 

Finding 1 (red line): Hoboken scores on the composite SAT are lower than would be expected by students from families making between $0-$20,000 a year. Moreover, this difference is VERY STATISTICALLY SIGNIFICANT (not occurring by chance). Effect size = .208 (small/medium)

Finding 1 (blue line): Hoboken scores on the composite SAT are lower than would be expected by students from families making between $20,000-$40,000 a year. Moreover, this difference is EXTREMELY STATISTICALLY SIGNIFICANT (not occurring by chance). Effect Size = .315 (medium)

Note: 
Effect size is a simple way of quantifying the difference between two groups that has many advantages over the use of tests of statistical significance alone (like a t-test). Effect size emphasises the size of the difference rather than confounding this with sample size. 


This analysis tries to bring some objectivity to the discussion of quality of education, especially in the Hoboken Public Schools. While its easy to have articulate, well intentioned parents to speak of the wonderful experiences their children are having in the schools and to hear the good news that often takes place at Board meetings, this analysis attempts to examine objective data in some context.

What does the SAT composite measure? According to the College Board: 
According to the College Board, the SAT measures literacy and writing skills that are needed for academic success in college. They state that the SAT assesses how well the test takers analyze and solve problems—skills they learned in school that they will need in college. The SAT is not an aptitude test. 
What does this mean? In common language it means that students taking the SAT are performing at levels lower than would be expected on the SAT Composite score based on the socio-economic status of their national cohort. 
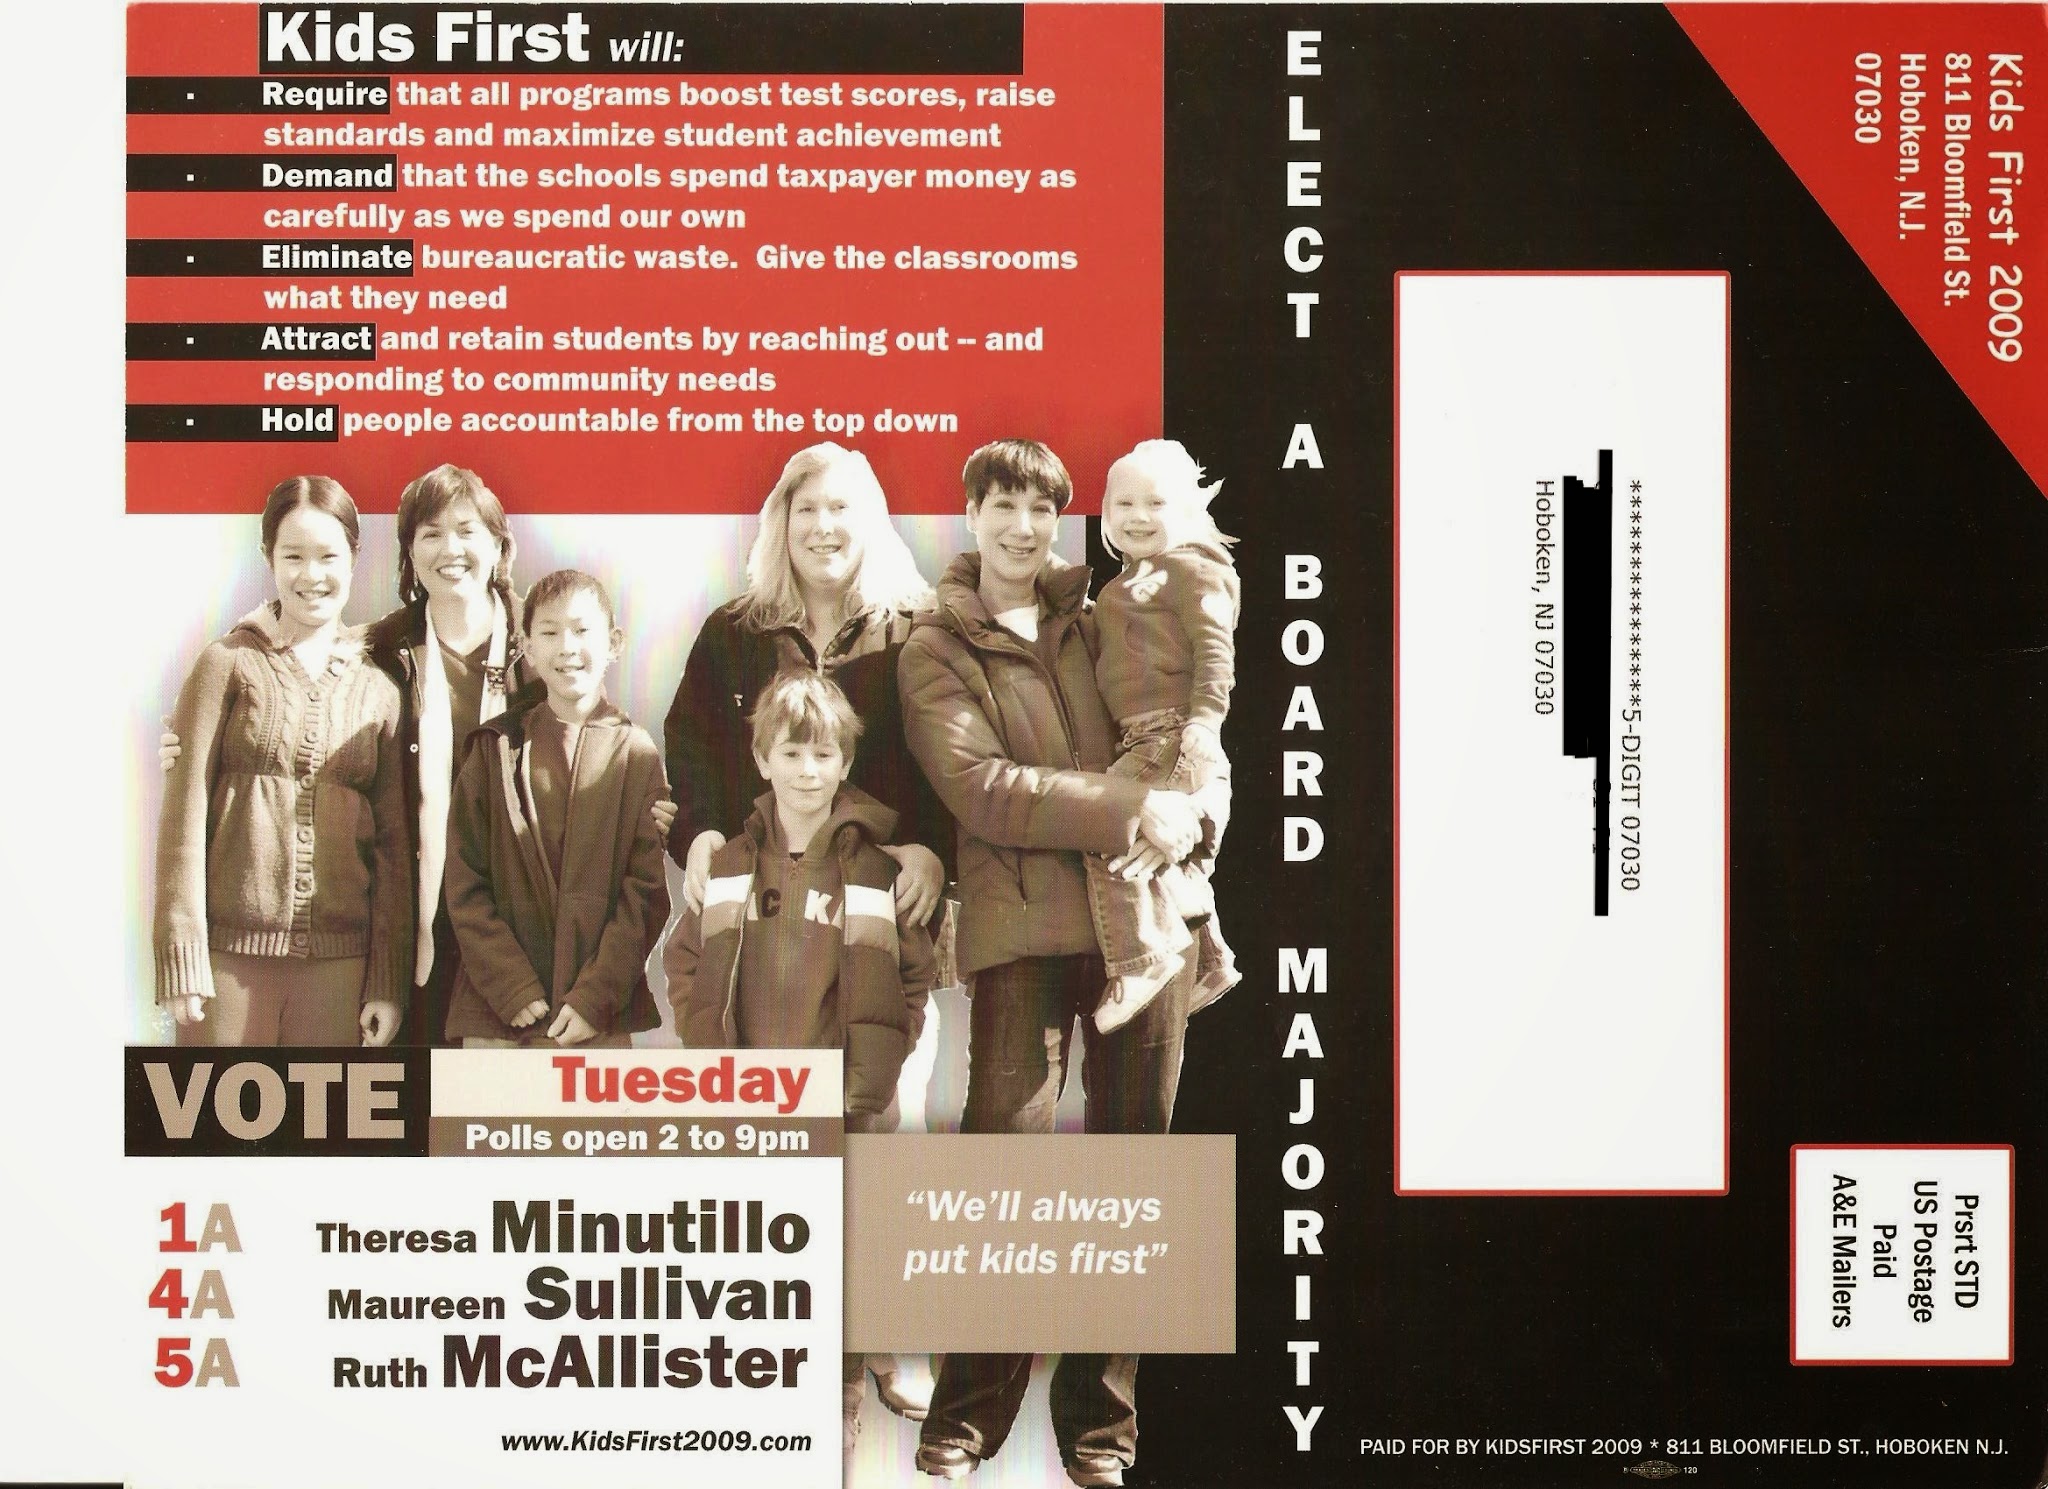
Kids First campaign literature 2009

One must consider that there is a non trivial number of students taking the SAT's in Hoboken from families making considerably more than $40,000 a year. 

Recently, Hoboken Superintendent Toback has discussed the so called "segregating" impact of charter schools on the school district. Board President Leon Gold has been quoted discussing the "white flight" occurring in the Hoboken School District because of charter schools. Perhaps these two gentlemen should concentrate on providing a better educational experience for the students already attending their schools and be less concerned with statements of segregation, "white flight",  and diminished expectations. -Dr. Petrosino


"The fact is that it is not an attack...It's just a suggestion that things should change." - Hoboken Superintendent of Schools -Dr. Mark Toback 

Please leave a comment if you would like.

-------------------------------------------------------

Unpaired t test results Finding I 

P value and statistical significance:
  The two-tailed P value equals 0.0026
  By conventional criteria, this difference is considered to be very statistically significant.

Confidence interval:
  The mean of $0-$20.000 minus HHS equals 136.00
  95% confidence interval of this difference: From 47.36 to 224.64

Intermediate values used in calculations:
  t = 3.0144
  df = 300048
  standard error of difference = 45.117

Review of data:
  Group   $0-$20.000     HHS  
Mean 1326.00 1190.00
SD 319.00 319.00
SEM 0.58 45.11
N 300000     50    

Cohen's d = .426
Effect Size (r) = .208

Unpaired t test results Finding II


P value and statistical significance:
  The two-tailed P value is less than 0.0001
  By conventional criteria, this difference is considered to be extremely statistically significant.

Confidence interval:
  The mean of $20K-$40K minus HHS equals 212.00
  95% confidence interval of this difference: From 123.36 to 300.64

Intermediate values used in calculations:
  t = 4.6989
  df = 300048
  standard error of difference = 45.117

Review your data:
  Group  $20K-$40K    HHS  
Mean1402.001190.00
SD319.00319.00
SEM0.5845.11
N300000    50   


Cohen's d = .6645
Effect Size (r) = .315

ALTERNATIVE ANALYSIS 

Another way to analyze the data would be to use a one-sample t-test, where you treat the district as a sample from the larger population, in this case the national SAT Composite average at the $0-$20,000 and $20,000-$40,000 family income categories. Using this approach, one would not want to compare the means as two independent samples via the more typical t-test comparison. In this scenario, it would be fine to talk about the difference in terms of standard deviations, since the SAT is normalized

For $0-$20,000 Analysis: 

For the $20,000- $40,000 Analysis: 

Summaries from this alternative analysis do not differ significantly from the original analysis along t-statistic, critical values, one-tailed probability, Cohen's d, or effect size. 


According to NJ.com, Hoboken Superintendent Toback Urged State to Deny Bilingual Charter's Expansion, Renewal

J.F. Kennedy Stadium (Circa 1968)
Let us turn the calendar back 4 months to when Hoboken Superintendent of Schools Mark Toback petitioned the State of New Jersey's Department of Education to not only reject a request by the Hola Dual Language Charter School to expand from a K-6 to a K-8 configuration but he also petitioned the state to "study the effectiveness" of the school before considering the renewal of the school charter itself (charter schools come up for renewal every 5 years). An odd request when one considers the clear academic record enjoyed by Hola and that the State of New Jersey already and continuously monitors all charter schools.  
Board President Leon Gold is claiming that a charter school (and it alone) is "bankrupting" the district and causing "white flight", Superintendent Toback is seeking "studies" being conducted to look at the effectiveness of charter schools before granting a renewal or awarding an expansion. Even Diane Ravitch is weighing in on this issueSo much concern over a single school. Perhaps its a good thing that attention is being paid...
-Dr. Petrosino

Update
On March 5, 2014 the New Jersey State Department of Education not only granted the Hola Dual Language School a renewal of its charter but also agreed to extend and expand Hola to include grades K-8.  

On March 11, 2014 the Hoboken Board of Education approved a motion to retain legal representation to appeal the decision to grant the Hola Dual Language School its approved expansion to 8th grade. -Dr. Petrosino 

By Kathryn Brenzel/NJ.com 
November 12, 2013 at 3:16 PM, updated November 12, 2013 at 10:52 PM


HOBOKEN — Amid requests to add middle-level grades to a Hoboken charter school, the district's superintendent is urging state officials to temporarily block the school's renewal.  
Citing funding, diversity and other issues, Superintendent Mark Toback said a study of the effectiveness of charter schools in the city should be conducted before the state signs off on a renewal or expansion of the HoLa Hoboken Dual Language Charter School.
A letter from Toback was posted to the board of education's website Monday night,  asking state officials to hold off on renewing the school's charter. The board of education will discuss Tuesday night whether or not the letter should be sent to state Department of Education Commissioner Christopher Cerf.
Toback said on Tuesday that he isn't seeking to have HoLa's charter revoked, just to have the state thoroughly examine the impact of charter schools in the city.
"The fact is that it is not an attack on charter schools," he said. "It's just a suggestion that things should change."
The request stems from the bilingual charter school's request to add six through eighth grades to its already existing kindergarten through fifth grade classes. Jen Sargent, the school's executive director and one of its founders, said the school already has state approval for sixth grade and would add the new classes gradually, with its existing students.    
She said that the requested expansion would allow students to continue their bilingual education —something wanted by both parents and students. Sargent said   that the superintendent's request threatens the existence of the four-year-old school.
"We've been peacefully coexisting for the last four years," she said. "There's no reason to think that another two grades would have a negative impact."
In his letter, Toback notes that Hoboken is uniquely situated: It has four public school districts operating within one square mile and a school board often torn between the interests of charter and public schools.
Representatives for the school board could not immediately be reached for comment.
He argues in the letter that HoLa's modest enrollment — the school currently has 254 students — and the history of transient student populations in Hoboken would make it extremely difficult for the charter school to sustain adequate enrollment in middle-level grades. Because the school is a dual language program, filling vacant seats is even more challenging, he said.  
He also noted that charters cause public schools to lose funding and can foster segregation of students. Charters can limit diversity, and it's the state's duty to ensure that the charter schools are taking a cross-section of the community's student population, in terms of racial and academic considerations, he said.
The costs of special education
in Hoboken's public schools is also on the rise, and charter schools don't
enroll significantly disabled students, he said. Toback said a study of "what has
been achieved" under HoLa's charter and how it has benefited the community should be conducted
before granting its expansion or renewal.
"We cannot continue to lose huge amounts of funding in our budget to support charters, especially at a time when we have increasing enrollment," he writes. "Our students require space and funding and our parents, students and community leaders should not be pitted against one another in a fight over those issues."

FULL STORY HERE

Tuesday, March 11, 2014

Hoboken School District- Analysis of 2012-13 Violence and Vandalism Report Data vs Hudson County School Districts

Data: NJ Department of Education
CLICK TO ENLARGE 
Summary: Hoboken reported a student population of 1706 students for the 2012-13 school year and Hudson County had a composite student population of 80,170 students. This means Hoboken made up about 2.13% of the county public school population. Therefore we would expect the corresponding percentages reported to be about the same-- meaning Hoboken would account for about 2.13% of the reported incidents of Violence, Vandalism, Weapons, Substance, and HIB (bullying). 

In actuality, Hoboken's share of Violence is 12.58% (nearly 6X higher than expected based on enrollment alone); Hoboken's share of Vandalism is 12.16% instead of the expected 2.13% (5.7X higher than expected). Hoboken's share of Weapons is 9.43% (4.4X higher than expected), Hoboken's share of Substances is 5.3% (2.5X higher than expected), Hoboken's share of HIB is 5.15% (2.4X higher than expected) and in total, while Hoboken accounts for 2.13% of the Hudson County enrollment for 2012-2013, it accounted for 9% of all reported incidents on the Violence and Vandalism Report (4.2X higher than expected). 


Looked at in another way, there were .96 Violence and Vandalism incidents reported per 100 students in Hudson County in 2012-2013 (a little less than 1 incident per 100 students). Hoboken's average was 4.04 incidents per 100 students. This is 4X the Hudson County rate and was the highest incident rate per 100 students for any district in Hudson County.


2012-2013 Violence and Vandalism Data- NJDOE 
CLICK TO ENLARGE 
But perhaps this was simply a one year aberration?-- that seems to be what some people would like to think given the comments on some recent posts on various local blogs. Unfortunately, the data does not really support this conjecture. An analysis of 4 years worth of data (2009-10 to 2012-13) indicate clearly that the Hoboken School District has consistently and significantly reported higher incidents per 100 students in terms of Violence and Vandalism reports than both county and state averages. These Violence and Vandalism rates have occurred under the Board leadership of the political group known as Kids First and the administrations of Superintendents Carter and Toback. I will expand on this in an upcoming post and compare Hoboken to other districts throughout the State of New Jersey. 


CLICK TO ENLARGE

Original Data Source: CLICK HERE 

Saturday, March 8, 2014

Analysis Shows Patch.com Ranking Follows a Multi-Year Trend of Elevated Violence and Vandalism in the Hoboken School District When Compared to Hudson County and State Rates Under Kids First/Carter/Toback Leadership

Original A&P- from Hoboken Historical Museum Archives 

9 Most Violent School Districts in New Jersey


Posted by  (Editor) , 
The New Jersey Department of Education on Thursday released its annual Violence, Vandalism and Substance Abuse in the Schools Report for 2012-2013.
The report documents self-reported incidents of violence in each district. Overall, the total number of incidents (violence, bullying, etc.) in New Jersey schools plummeted by 19 percent from the previous year, led by a 36 percent drop in the number of bullying incidents reported.
Overall violence in New Jersey schools was down 4 percent year-over-year.
While school districts in cities such as Newark and Camden led the way in total number of incidents, there were many districts that had a higher ratio of incidents of violence. Camden, for instance, reported 163 incidents of violence — in a district of 12,608 students.
But Lakewood, in Ocean County, reported 145 incidents of violence in a district with more than 7,000 fewer students. So we decided to take a look at the report in the context of how many students attend school in each of the districts, and construct a list of the districts with the highest ratio of incidents of violence per student.
A few caveats: We only included districts with more than 500 students that also have a high school. We also omitted charter schools and special services districts. And remember, this data is self-reported by the districts, and does not differentiate based on the severity of the incident. Oh, and why nine? We placed the cutoff for inclusion at a ratio of .020.
And for comparison, there were 7,895 incidents of violence among New Jersey’s 1,369,554 students, a ratio of .005.

COMMENTARY: Some posters from Hoboken have disregarded the #9 ranking claiming methodological issues or errors in sampling, under reporting or even ill-intent. I cannot speak to any of these issues but to the best of my knowledge, no district has been cited by the State of New Jersey for "under reporting." I can offer a comparison of the average incidents in the Hoboken Public Schools (measured in incidents per 100 students) compared to Hudson County (the county in which Hoboken resides) and the State of New Jersey averages (see graphic below). The reader is left to make their own decisions and conclusions. CLICK HERE to read an earlier post on violence and vandalism rates.

CLICK TO ENLARGE


COMMENTARY (cont.): The previous 3 years worth of data (2009-10, 2010-11, 2011-12) makes it clear that the 2012-2013 ranking of the Hoboken School District as New Jersey's 9th Most Violent School District is not necessarily inconsistent with previous data or should have come as much of a surprise. Additionally, the three year trend triangulates the findings of Patch.com's analysis by using a different rubric (incidents per 100 students). 

n.b. : An interesting series of comments were posted in response to this post (see end of this blog).

PATCH.com's ranking:
Ranking) District, County (# of students, Incidents of Violence, Ratio)

State of New Jersey (1,369,554; 7895; .005)

1) Wildwood City Cape May County (852, 24, .0282)
2) Lakewood Township, Ocean County (5186, 145, .0280)
3) Willingboro Township, Burlington County (3952, 108, .0273)
4) Camden County Vocational (2158, 55, .0255)
5) High Point Regional, Sussex County (1005, 25, .0249)
6) Palmyra Borough, Burlington County (965, 23, .0238)
7) Florence Township, Burlington County (1593, 37, .0232)
8) Burlington County Vocational (2100, 48, .0229)
9) Hoboken, Hudson County (1706, 36, .0211)


Outofcontrol December 07, 2013 at 04:11 AM
Way to go, Kids First! You finally made the top 10.
Grafix Avenger December 09, 2013 at 10:42 AM
Shame on Patch for publishing a poll 'cooked' to damage the Hoboken Public School District- the 'REAL' results using all (not selective) NJDOE data: http://grafixavenger.blogspot.com/2013/12/cooked-poll.html
Tom Troncone (Editor) December 09, 2013 at 03:54 PM
Holy cow, you guys... GA, The report was released by the state last week. I thought it would be interesting to take the column "incidents of violence" and apply the same methodology one might use with crime stats. In other words, if a town has 30 assaults and 10,000 people, and another town has 300 assaults and 100,000 people, the rate of assaults is higher in the first district. It's the same concept. And the caveats? I had to have at least a certain number of students in a district for the numbers to mean anything. Some districts have 80 kids. Having 2 incidents of violence could skewer the whole thing. Same with charter schools. I would argue that the only column that makes sense to use in this is the "violence" one because violence could include the other categories, something could be bullying AND violence, thereby meaning any other methodology could count incidents twice. I make tons of these lists. Do you think I really sat down and said "okay, let's see, how can I make a list on school violence that makes 1 of the 240 towns my people cover look bad?" No. We published another list today on total instances of bullying. Hoboken is not on that list. You can put away the tinfoil.
Grafix Avenger December 09, 2013 at 04:40 PM
You thought it was "interesting"? Interesting to call a school district one of the most violent in the state? That is the HEIGHT of reckless and irresponsible journalism with real consequences. My 6th grader told me at pick-up today, a boy in her class said his father wants to pull him out of public school because the high school is the "9th most dangerous". Thank you, Mr. Troncone. You are incredibly irresponsible and your attitude shows you don't understand the consequences to families when you call their schools "violent". No, the tin foil belongs over your keyboard. I am not going to argue with you because you'll justify your arbitrary data harvesting, that you think is "interesting" while families are going to be afraid to use the schools. No charters? Do you make tons of lists. So do I. But I don't equate groceries and/or things which impact myself with those which impact families. Do you think in this day and age of school shootings, etc. that calling a district "violent" does not have consequences? Incredibly reckless. The poll on my blog is at least 'fair', and lumps all incidents together because there is an overlap that cannot be distinguished on a spreadsheet. A bully can have a weapon, or a drugs can cause violence and/or vandalism. The number of kids in the district is irrelevant if your child is the victim of an incident. You've done harm, but to you it's "interesting".
Tom Troncone (Editor) December 09, 2013 at 05:13 PM
I'm sorry if you don't like the fact that there were 36 incidents of violence in Hoboken schools last year which, for a student body of 1,706 kids, is actually quite a bit. In fact, that ratio -- the same method used for crime stats I'll add -- was the 9th most in the state for districts with student bodies of more than 500. That is an absolute and irrefutable fact. When you do crime stats, you end up with a "Total Violent Crime Index" or something similar. You wouldn't include people who were caught with drugs, or people caught carrying a knife, in violent crime stats, right? Only if they used the knife and, at that point, it would move to the "violence" category. I looked at the data completely impartially. It is YOU who have created an alternative construct that manipulates the data by including data that would not fall under the definition of violence. It's a simple category: Incidents of Violence in School Districts. I know I can't win this argument with you, so I'm just going to accept that we disagree. I'd argue that shining a light on this is a public service and might actually do some good, but I know you won't see that side of it.
QJ201 December 09, 2013 at 06:14 PM
Mr Troncone you simply misrepresented the facts and got a hit generating headline out of it. Inferring that your critic is wearing a "tinfoil hat" is not a valid counterargument. However, there is ample evidence over the past year that Hoboken Patch has been manipulated or willingly posted stories to serve political agendas. AND for the statistically challenged....these are simply "descriptive statistics" these data were not analyzed using "inferential statistics" that are used to show "significant associations." Claiming that some districts aren't large enough to include is a presumption (or requirement) made for inferential statistics (e.g., cell sizes, sample sizes, effect sizes) and not descriptive statistics, so not a valid argument to use to defend your reporting of the data.
Grafix Avenger December 09, 2013 at 06:51 PM
Well, Troncone should be happy to know his "9th Most Violent" indictment of Hoboken's School District was the talk of Hoboken High School kids today, so I hear from a friend's son. And a kid in my daughter's class was talking about how his dad is going to pull him out because our district is one of the most "violent" in the state. Troncone's attempts to justify his incredibly irresponsible and harmful piece to the Hoboken district are ridiculous. I didn't hear why Charters were excluded. Now parents are citing this garbage and fearful of staying in the district. Nice job. Troncone's arbitrary choices and false conclusions will effect families all over our district. My kid is in public school. Mr. Troncone, how dare you trivialize my concerns with that "tin foil" crack. Patch should retract this crap, though the damage is done.
Tom Troncone (Editor) December 09, 2013 at 07:25 PM
For the record, 'tin foil' was in reference to commenters on the GA blog, who insist we were 'fed' the report and have a political agenda. We don't.
Shorty December 09, 2013 at 07:52 PM
Why didn't you list charters? Why would you omit districts with high schools? Don't you think it would interest parents if elementary and middle schools had a high violence rating? Why are the other schools' photos have vague pictures of their school districts? Really? You couldn't find a photo of Florence Twp schools other than at 20,000 feet? Other districts blocked by trees and water? Really? Hoboken High is front and center. You've been played. That's some lazy 'journalism' there.
Shorty December 09, 2013 at 07:53 PM
that's without high schools...

Shorty December 09, 2013 at 07:52 PM
Why didn't you list charters? Why would you omit districts with high schools? Don't you think it would interest parents if elementary and middle schools had a high violence rating? Why are the other schools' photos have vague pictures of their school districts? Really? You couldn't find a photo of Florence Twp schools other than at 20,000 feet? Other districts blocked by trees and water? Really? Hoboken High is front and center. You've been played. That's some lazy 'journalism' there.
Bokenlvr December 18, 2013 at 11:22 AM
Tom Troncone - this guy is certainly not a good, even passable, journalist - tom the numbers can be used to show anything anybody on either side of any issue wants to show - still wet behind the ears or just really have a problem with hoboken BOE schools - which is it? all they have to do is choose the ones with the biggest punch - you want internet hits on your "reporting" at a huge cost to real people - the town suffers because of your inaccurate piece - you are no journalist - you're a hack, pal. sorry but its disgraceful - you need real insight into the issue - please do some research
Mickey Brandt December 29, 2013 at 08:28 PM
I'm not even an observer of Hoboken civic issues, I'm quite removed. I am versed in journalism issues, though, and recognize the achievement of generating such passionate interest with news analysis. Congratulations to Patch on this. I see little need to defend it.
Hoboken Education Association December 30, 2013 at 06:57 PM
This report and even addressing it is reckless and irresponsible. This report is a slap in the face to every student, parent, and teacher of the Hoboken public schools. The issue here is some creative reporting by other school districts. You are telling me that the Hoboken public schools are more violent and dangerous than Jersey City or Newark public schools? That is not the case. The issue here is the other school districts do not report incidents. We in the Hoboken public school system have honesty and integrity and that is why we report every incident. The issue is is that the report is absurd to begin with. If a student damages a textbook by definition that is vandalism and makes its way onto the report. According to the state report a simple act of textbook damage (vandalism) has the same weight as a school brawl. As a teacher in the Hoboken public schools I can tell you this, I have never, not once feared for the safety of myself or my students. They are rarely incidents of violence and Hoboken public schools. Our school district is not like any other school district in the entire nation. Kids will disagree and have misunderstandings, just like everyone of you when you went to school. If you look at the list of the schools and/or their districts it is absurd. Again, I have to mention there is no mention of the Newark public schools, Camden public schools, or Jersey City public schools. School districts are usually indicative of the community that they are apart of. Those cities are three of the highest crime rates in the state and not one of their schools made the list? Hmmmm. I find that curious.
melina white January 11, 2014 at 04:26 AM
Tom T - you can't present irrefutable facts to those living in an alternative reality. Hoboken will find a to smear your name and take you to court using tax payer dollars. Call the town the best place to flirt, or the best small town, best for small dogs etc and you'll be in their good graces.
melina white January 11, 2014 at 04:32 AM
QJ201- I am hardly mathematically, scientifically or philosophically challenged and I don't see any misrepresentation here. Commenters are making inferences that cannot be drawn from the article.
melina white January 11, 2014 at 04:33 AM
GA that's right cooked info should only be used when wanting to make the district appear shinning.
melina white January 11, 2014 at 04:43 AM
Why not just take the numbers and suggestion from the NJ Commissioner of Education and make some improvements?
Edazare January 29, 2014 at 06:16 PM
In her 8th year in the district, my daughter has never seen or heard anything resembling violence or danger. If you asked her about violence, she would be baffled by the question. Her Hoboken Public School experience has been full of kindness and respect, while learning from hard working, well-educated, and caring teachers. Parents have nothing to fear - any more than they would anywhere else.