 |
| Figure 1: 1998-2016 Free or Reduced Lunch Percentage CLICK TO ENLARGE |
According to Merrian-Webster dictionary white flight is the departure of whites from places (as urban neighborhoods or schools) increasingly or predominantly populated by minorities. Perhaps a more expansive approach to "white flight" might include socioeconomic status or class after all sometimes people use the term "white" as a euphemism for other conditions (class, income) which we may feel uncomfortable discussing.
So, are charter schools having a segregative impact on the Hoboken Public Schools causing "white flight" as claimed by a number of Hoboken Board of Education members and realized in terms of an exodus of non-free or reduced students (a.k.a. "middle class")?
The short answer is that over the past 18 years the percentage of students identified as qualifying for free or reduced lunch has declined from 86% to 53% (see Figure 1).
For 2015-16 there were a total of 1943 students in the district and 1021 received either free or reduced lunch. This means the percentage of FRL students for 2015-16 in the Hoboken School District was about 53%.
 |
| Figure 2: 2015-16 Hoboken City Enrollment Data CLICK TO ENLARGE |
Recall, in 2013-14 the percentage as reported by the Education Law Center was 49%.
 |
| Figure 3: 2013-14 Hoboken City FRL Percentages CLICK TO ENLARGE |
I did some additional research and looked up some archival data.
For 2005-06, about a decade ago, there were a total of 1900 children in the school district and 1491 qualified for either Free or Reduced Lunch. This means the percentage of FRL in 2005-06 in the Hoboken School District was about 78.47%
 |
| Figure 4: 2005-06 Hoboken City Enrollment Data Click to Enlarge |
For 1998-99, the oldest data I could find fairly quickly, there were 2625 children in the school district and 2266 qualified for either free or reduced lunch. This means the percentage of FRL students for 1998-99 in the Hoboken School District was about 86.32%
 |
| Figure 5: 1998-99 Hoboken City Enrollment Data Click to Enlarge |
After finding the 1998-99 data I thought it would be interesting to gather data for EACH year in order to get a more fine grain look at the data over a long stretch of time-- in this case, 18 years. This also compliments an analysis I did previously where we looked at the percentage of students identified as "white" in the Hoboken School District.
Summary: "White flight" and segregative impact may be a challenge to convince open minded people and independent third parties when data indicates the percentage of white students have been on an 18 year rise (from @15% to 33%) AND the percentage of students from families meeting criteria for free or reduced lunch have declined significantly (from 86% to 53%) over the same time period in the Hoboken School District.
“they’re (charter schools) fostering white flight, and they’re bankrupting us,” the city’s school board head charged in a Wednesday interview. “We are creating separate but equal school systems,” warned Hoboken Board of Education president Leon Gold -Salon (3/14/14)
Further Clarification: Some regular readers of this blog pointed out that further clarification might be needed. I agree. It is important to understand that this data on Free or Reduced Lunch eligibility (Figure 1)
is at the full district level and not disaggregated. Grade by grade
analysis (i.e. disaggregated) reveals different and also concerning trends of the Hoboken
School District's inability to retain the non Free or Reduced eligibility population of students
it has enrolled in the early grades (Figures 6 and 7 below). In short, the students categorized as non Free or Reduced Lunch eligible are primarily, although not exclusively, in the early grades. What percentage of the non Free or Reduced eligibility population of students that have left the Hoboken School District are also considered white is an interesting question but outside the focus of this particular post.
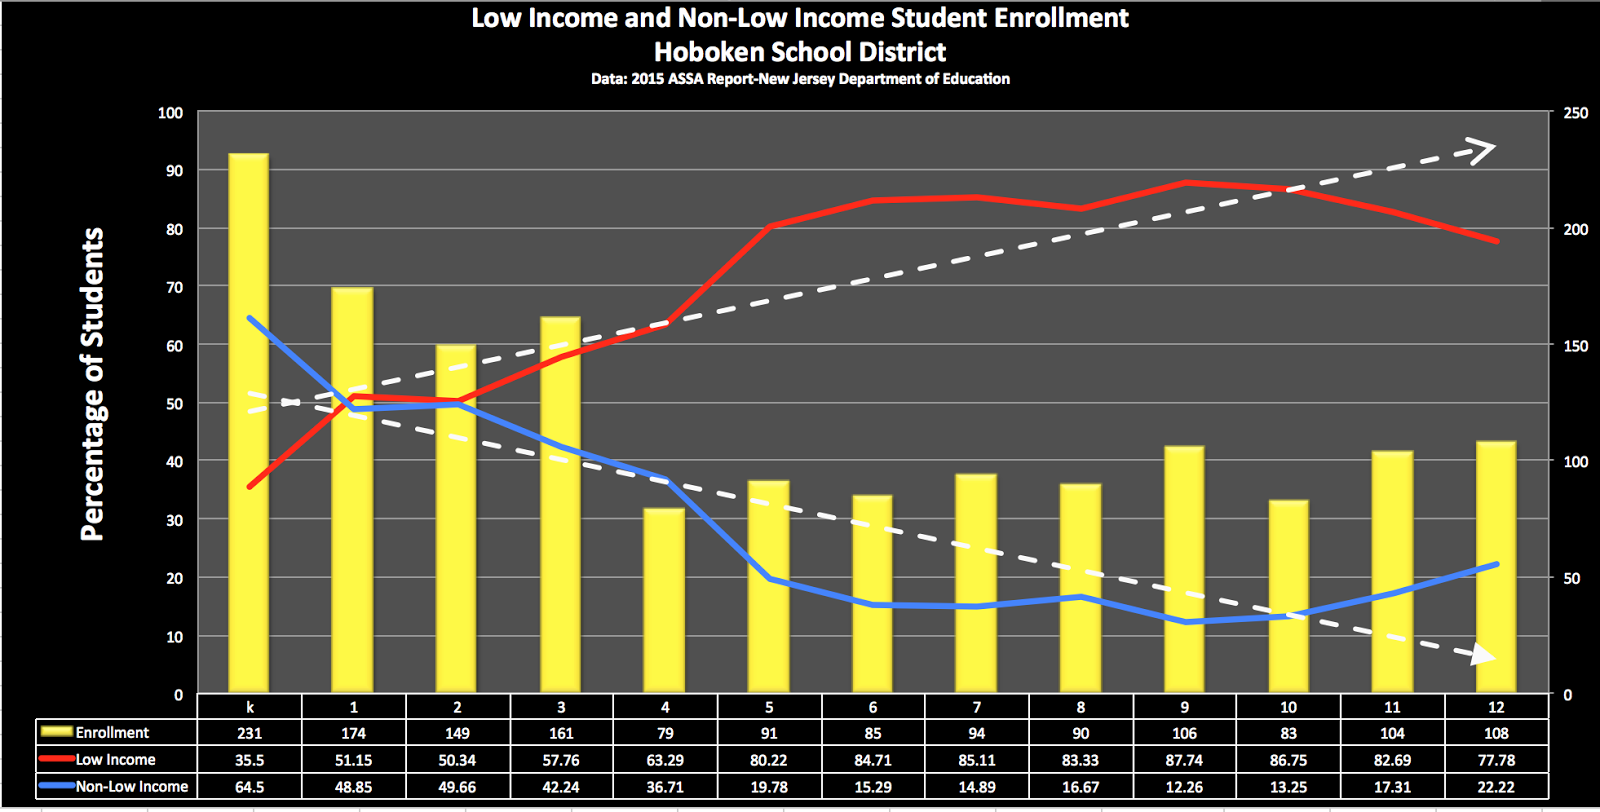 |
| Figure 6- Example of disaggregated data |
 |
| Figure 7- Example of disaggregated data |
